Why Does the Price of Bitcoin Rise When the US Government Shuts Down?
The U.S. Government Shutdown has officially entered a record-breaking 36th day.
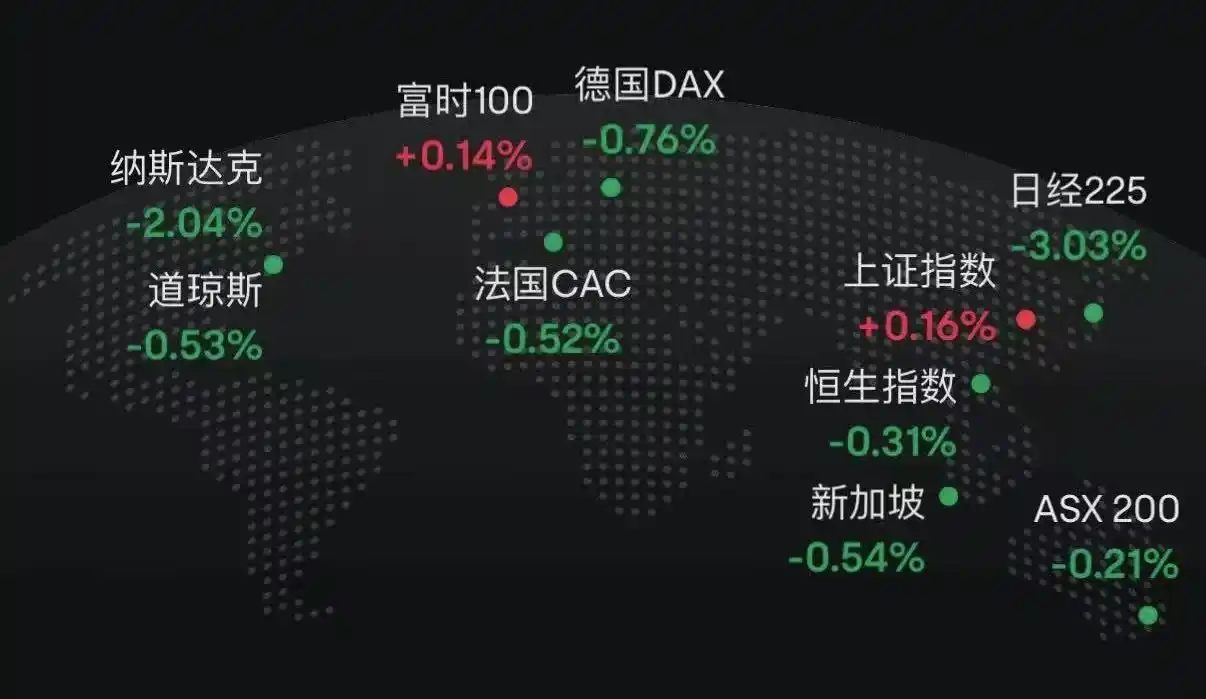
Over the past two days, global financial markets have experienced a downturn. The Nasdaq, Bitcoin, tech stocks, the Nikkei Index, and even safe-haven assets like Treasury bonds and gold have not been spared.
Fear has gripped the markets, while Washington politicians continue to bicker over the budget. Is there a connection between the U.S. Government Shutdown and the global financial market decline? The answer is emerging.
This is not a typical market pullback but a liquidity crisis triggered by the government shutdown. With fiscal spending frozen, hundreds of billions of dollars are locked in the Treasury's accounts, unable to flow into the market, disrupting the financial system's circulation.
The "True Culprit" of the Downturn: The Treasury's "Black Hole"
The U.S. Treasury's General Account, known as the TGA, can be understood as the U.S. government's central checking account held at the Federal Reserve. All federal revenues, whether from taxes or the issuance of Treasury securities, are deposited into this account.
Similarly, all government expenditures, from paying civil-servant salaries to defense spending, are disbursed from this account.
Under normal circumstances, the TGA serves as a fund's relay station, maintaining a dynamic balance. The Treasury receives money and promptly spends it, with funds flowing into the private financial system, becoming bank reserves, providing liquidity to the market.
The government shutdown has disrupted this cycle. While the Treasury continues to receive money through taxes and bond issuance, the TGA balance keeps growing. However, as most government agencies are closed due to Congress's failure to approve a budget, the Treasury cannot spend as planned. The TGA has turned into a financial black hole, receiving but not releasing funds.
Since the shutdown began on October 10, 2025, the TGA balance has expanded from around $800 billion to over $1 trillion by October 30. In just 20 days, over $200 billion has been sucked out of the market and locked in the Fed's vault.
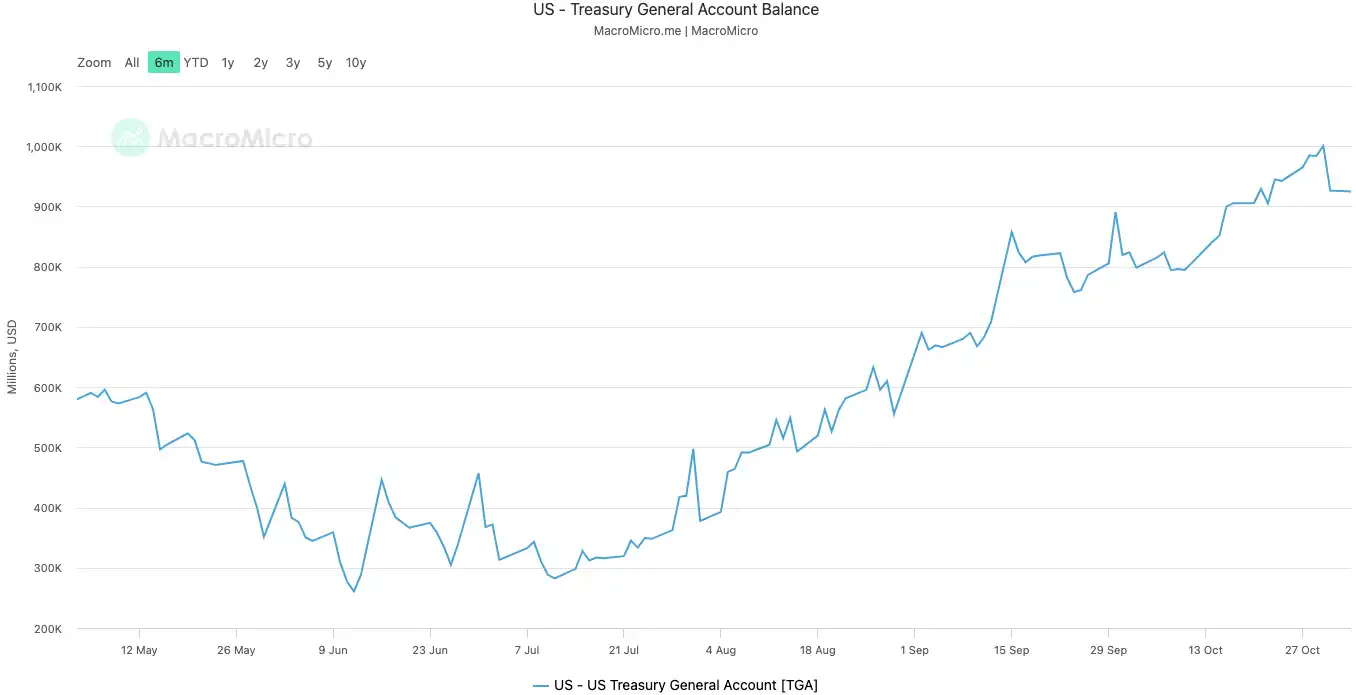
U.S. Government's TGA Balance | Image Source: MicroMacro
Analysts suggest that the government shutdown has drained nearly $700 billion of liquidity from the market within a month. This effect is comparable to multiple rounds of Fed rate hikes or accelerated quantitative tightening.
When the reserve of the banking system is heavily siphoned off by the TGA, both the ability and willingness of banks to lend decrease significantly, leading to a surge in the market's funding cost.
The first to feel the chill are always those assets most sensitive to liquidity. The cryptocurrency market crashed after the shutdown on October 11, with the liquidation scale approaching $20 billion. Tech stocks also teetered this week, with the Nasdaq index falling 1.7% on Tuesday, plummeting after Meta and Microsoft's earnings reports.
The global financial market decline is the most tangible manifestation of this invisible tightening.
The System is "Running a Fever"
The TGA is the "cause" of the liquidity crisis, and the soaring overnight repo rate is the most direct symptom of the financial system "running a fever."
The overnight repo market is where banks lend short-term funds to each other, serving as the capillary of the entire financial system, with its rate being the most authentic indicator of the tightness of the banking system's "money root."
During times of abundant liquidity, interbank borrowing is easy and rates are stable. However, when liquidity is drained, banks run out of money and are willing to pay a higher price to borrow overnight.
Two key indicators clearly show how severe this high fever is:
The first indicator is the SOFR (Secured Overnight Financing Rate). On October 31, the SOFR surged to 4.22%, marking the largest daily increase in a year.
This rate is not only above the Federal Reserve's target range of 0-4.00%, but it is also 32 basis points higher than the effective federal funds rate, reaching its highest level since the market crisis in March 2020. The actual borrowing cost in the interbank market has spiraled out of control, far exceeding the central bank's policy rate.
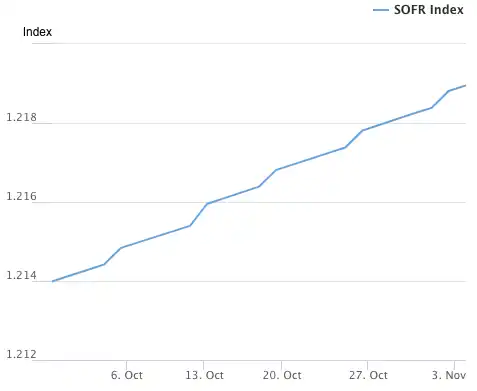
Secured Overnight Financing Rate (SOFR) Index | Source: Federal Reserve Bank of New York
The second, even more astonishing indicator, is the amount of the Federal Reserve's SRF (Standing Repo Facility) usage. The SRF is an emergency liquidity tool provided by the Federal Reserve to banks so that when they can't borrow in the market, they can pledge high-grade bonds to the Fed in exchange for cash.
On October 31, SRF usage surged to $503.5 billion, hitting the highest level since the March 2020 pandemic crisis. The banking system has plunged into a severe dollar shortage, having to knock on the Fed's last resort window.
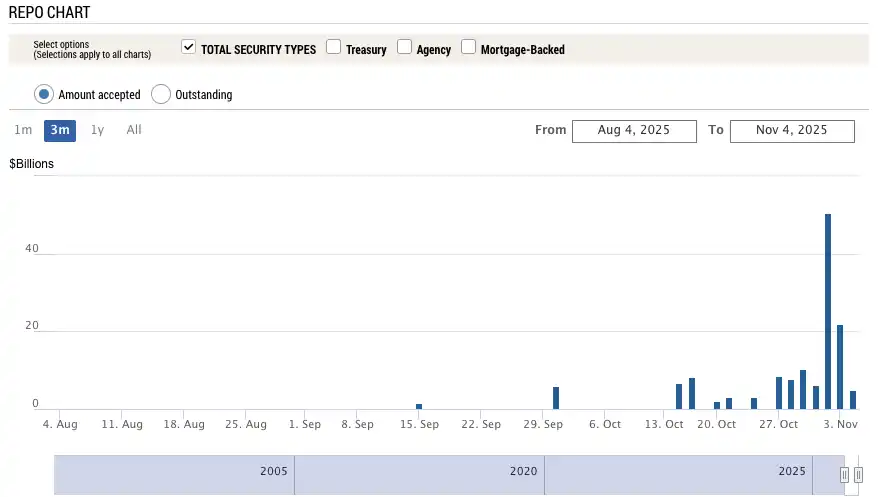
Sustainable Repo Facility (SRF) Usage|Source: Federal Reserve Bank of New York
The overheating of the financial system is now transmitting pressure to the vulnerable sectors of the real economy, triggering long-dormant debt landmines. Currently, the two most dangerous areas are commercial real estate and auto loans.
According to data from research firm Trepp, the default rate for U.S. office CMBS commercial real estate mortgage-backed securities reached 11.8% in October 2025, hitting not only a historic high but also surpassing the peak of 10.3% during the 2008 financial crisis. In just three years, this number has surged nearly 10 times from 1.8%.
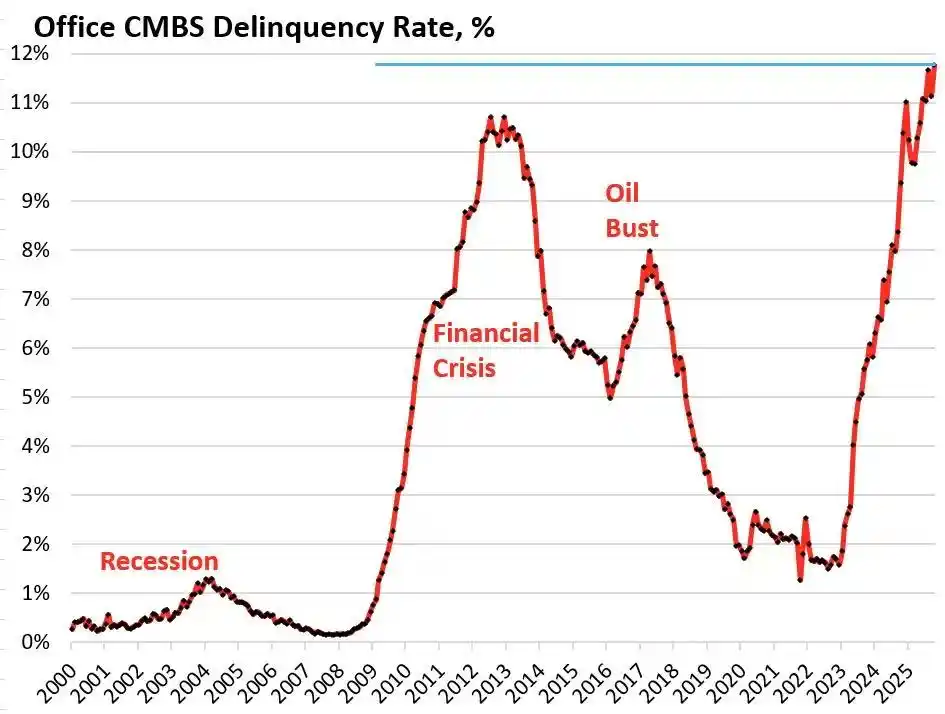
Default Rate of U.S. Office CMBS Commercial Real Estate Mortgage-Backed Securities|Source: Wolf Street
The Bravern Office Commons in Bellevue, Washington, is a typical case. This office building, once fully leased by Microsoft, was valued at $605 million in 2020. Now, with Microsoft's departure, the valuation has plummeted by 56% to $268 million and has entered default proceedings.
This most severe commercial real estate crisis since 2008 is spreading systemic risk throughout the entire financial system through regional banks, real estate investment trusts (REITs), and pension funds.
On the consumer side, the alarm bells for auto loans have also gone off. New car prices have soared to an average of over $50,000, and subprime borrowers are facing loan interest rates as high as 18-20%, ushering in a wave of defaults. As of September 2025, the default rate for subprime auto loans has approached 10%, and the overall auto loan delinquency rate has grown by over 50% in the past 15 years.
Under the pressure of high interest rates and inflation, the financial situation of America's lower-income consumers is rapidly deteriorating.
From the invisible tightening of the Treasury General Account (TGA), to the systemic overheating of overnight rates, to the debt landmines in commercial real estate and auto loans, a clear crisis transmission chain has emerged. The spark unexpectedly ignited by Washington's political deadlock is now setting off the structural weaknesses that have long existed within the U.S. economy.
How Are Traders Viewing the Market Outlook?
Facing this crisis, the market has fallen into a deep division. Traders stand at a crossroads, passionately debating the future direction.
The bearish camp represented by Mott Capital Management believes that the market is facing a liquidity shock comparable to the end of 2018. Bank reserve levels have dropped to a dangerous point, similar to the situation during the market turbulence caused by the Federal Reserve balance sheet reduction in 2018. As long as the government shutdown continues and the Treasury General Account (TGA) keeps draining liquidity, the market's pain will not end. The only hope lies in the Quarterly Refinancing Announcement (QRA) that the Treasury is expected to release on November 2nd. If the Treasury decides to lower the target balance of the TGA, it could release over $150 billion in liquidity into the market. However, if the Treasury maintains or increases the target, the market's winter could become even longer.
The optimistic camp led by renowned macro analyst Raoul Pal has put forward a fascinating theory called the "Pain Trade Window." He acknowledges that the current market is in a painful liquidity squeeze window but firmly believes that a liquidity flood will follow. Over the next 12 months, the U.S. government has up to $10 trillion in debt to roll over, forcing it to ensure market stability and liquidity.
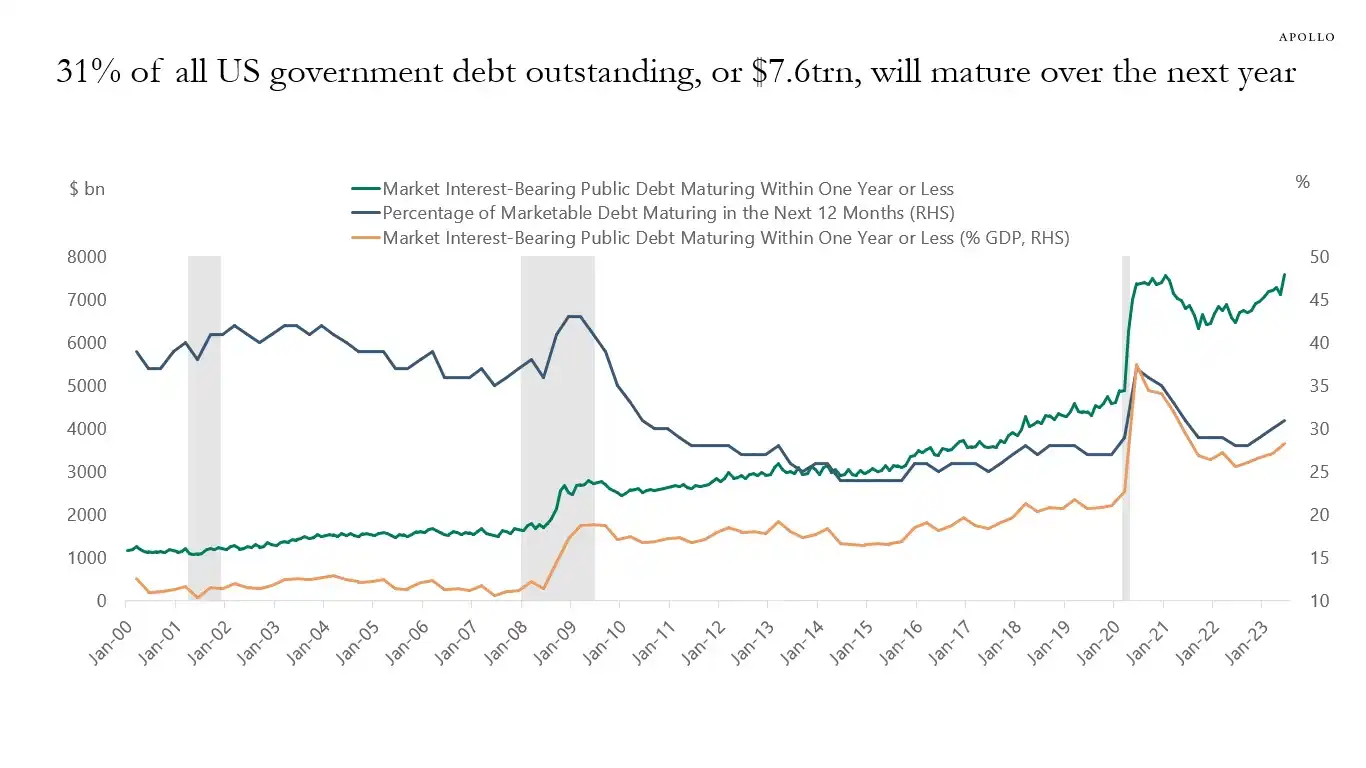
31% of U.S. government debt (approximately $7 trillion) will mature in the next year, and with new debt issuance, the total amount could reach $10 trillion|Image Source: Apollo Academy
Once the government shutdown ends, suppressed hundreds of billions of dollars in fiscal spending will flood into the market like a deluge, and the Federal Reserve's Quantitative Tightening (QT) may also come to a technical end, and even reverse.
To gear up for the midterm elections in 2026, the U.S. government will stimulate the economy at any cost, including interest rate cuts, relaxed bank regulations, and the passage of cryptocurrency bills. With China and Japan also continuing to expand liquidity, the world will witness a new round of monetary easing. The current pullback is just a shakeout in the bull market, and the true strategy should be to buy on the dips.
Mainstream institutions like Goldman Sachs and Citigroup hold a relatively neutral view. They generally expect the government shutdown to end within the next one to two weeks. Once the deadlock is broken, the substantial cash locked up in the TGA will be swiftly released, easing the market's liquidity pressure. However, the long-term direction still depends on the Treasury's QRA announcement and the Fed's subsequent policies.
History seems to be repeating itself. Whether it was the taper tantrum of 2018 or the repo crisis of September 2019, both ultimately ended with the Fed's surrender and re-injection of liquidity. This time, facing dual pressures of political deadlock and economic risks, policymakers seem to have once again arrived at a familiar crossroads.
In the short term, the fate of the market hangs on the whims of Washington politicians. But in the long run, the global economy seems to be deeply trapped in a cycle of debt-monetization-bubble that it cannot escape from.
This crisis, unexpectedly triggered by the government shutdown, may only be the prelude to the next round of a larger-scale liquidity deluge.
You may also like

Morning Report | BitMine increased its holdings by 126,971 ETH last week; trader Eugene announced his exit from the crypto market

Wang Chuan: How can one not feel anxious after the neighbor Old Wang made thirty times profit by investing in storage stocks? (Seven) - A quarter-century cycle

Cryptocurrency CEXs are flocking to sell US stocks, and traditional brokerages are facing an "uninvited guest."

$75 billion in foreign capital has fled, and South Korean retail investors have absorbed it all using leverage

Japan’s Three Megabanks Plan Joint Stablecoin Issuance in Fiscal 2026
MUFG, SMBC, and Mizuho reportedly plan to jointly issue fiat-pegged stablecoins in fiscal 2026, signaling Japan’s growing push into bank-led digital payment infrastructure.

Humanity Discloses H Token Dual-Chain Attack Details, With Losses on Ethereum and BSC Exceeding $36 Million
Humanity said the H token attack across Ethereum and BSC caused more than $36 million in losses after leaked ProxyAdmin keys enabled malicious contract upgrades and token minting.
White House Discusses CLARITY Act With Law Enforcement Ahead of Senate Vote
The White House discussed the CLARITY Act with law enforcement ahead of a Senate vote, focusing on illicit finance risks and developer protections.

Bitcoin Trading Guide 2026: Strategies for Experienced Traders

What Is XAUT and PAXG? Why Tokenized Gold Is Booming in 2026

Will the SpaceX IPO Hurt Bitcoin? Here's What Traders Are Watching

Foreign selling in the South Korean stock market accelerates, with cumulative net sales reportedly reaching $75 billion this year
On June 9, The Kobeissi Letter, citing Goldman Sachs data, reported that global investors are selling South Korean stocks at an unusually rapid pace. In the latest trading session, foreign investors sold about $801 million worth of Kospi constituent stocks again; total foreign outflows last week reached about $10 billion, and the market has been in net foreign selling on nearly every trading day over the past month. According to the data cited in the report, foreign investors have sold about $75 billion worth of South Korean stocks so far this year. Meanwhile, South Korean retail and institutional investors together recorded roughly $69 billion in net buying over the same period, suggesting that the market’s main buying support has come from domestic capital rather than returning overseas funds. The information currently disclosed still mainly comes from The Kobeissi Letter’s retelling and Goldman Sachs data summaries, while public details on the statistical period and the specific definition of “selling” remain relatively limited.

Fortune Warns of Strategy’s Financing Structure Risks as Bitcoin Premium Narrows
Fortune warned that Strategy’s Bitcoin treasury model faces growing financing risks as MSTR’s net asset premium narrows and preferred stock dividend pressure increases.

Ferrari Challenge Le Mans: Carl Moon to Dominate in WEEX Livery

Sahara AI Responds to SAHARA’s Sharp Drop: No Contract or Product Security Issues Found, Internal Investigation Underway
Sahara AI responded to SAHARA’s 60% price drop, saying no token contract or product security issues have been found and an internal investigation is underway.

WEEX Deposit/Withdrawal Dynamic Island: Your Asset Status, Always in Sight
Scaling Crypto Derivatives: The Digital Asset Infrastructure Behind High-Volume Trading
In the fast-moving digital asset ecosystem, derivatives platforms face an extreme architectural test. High-leverage futures markets demand more than just standard security—they require absolute operational precision, zero-latency matching engines, and ironclad structural scalability, all while navigating intense market volatility.
As global platforms scale to meet these demands, the industry is shifting away from rigid, monolithic setups toward a more agile, "decoupled" infrastructure philosophy.
The Blueprint for High-Volume Copy TradingFor elite global exchanges like WEEX (founded in 2018), this architectural choice becomes critical when scaling high-volume retail features like social copy trading. When thousands of users automatically mirror the real-time strategies of elite traders simultaneously, it triggers sudden, monumental spikes in concurrent transactional volume.
To prevent execution latency or settlement bottlenecks during these peak volatility events, a platform's primary engine must remain entirely dedicated to risk management, copy-trade synchronization, and order matching.
The Architectural Rule: New-generation platforms must separate front-end user execution engines from heavy backend infrastructural overhead to eliminate operational friction.
By separating these layers, platforms can maintain complete sovereignty over their trading environments and user experiences while strategically aligning with institutional-grade infrastructure ecosystems. This strategic framework allows modern exchanges to leverage advanced Digital Asset Custody infrastructure such as Cobo’s behind the scenes, ensuring that backend wallet management scales elastically alongside trading spikes.
Capitalizing on Market Momentum and 400× LeverageIn a derivatives arena where platforms offer up to 400× leverage on perpetual contracts, capital efficiency and market agility are core business metrics. To capture market momentum, an exchange needs the ability to rapidly expand its asset offerings, supporting everything from legacy crypto assets to sudden, trending altcoins across a massive library of trading pairs.
Adopting a flexible, scalable Wallet-as-a-Service (WaaS) solution such as Cobo’s could completely rewrite the development timeline for high-growth exchanges. Instead of spending months of engineering capital building out custom backend wallet architectures for every new blockchain network, platforms can deploy localized infrastructure in days.
This agility allows platforms to instantly scale their listings to over a thousand trading pairs without compromising security or delaying time-to-market. It mirrors the exact operational advantages seen during high-velocity market events, similar to how advanced wallet infrastructure empowers platforms during sudden asset surges; allowing exchanges to pass that speed and liquidity directly to their global user base.
A Mature Foundation for GrowthThe synergy between trusted infrastructure ecosystems and global trading platforms represents the natural evolution of a maturing crypto market. As WEEX continues to scale its global spot and derivatives offerings for over 6 million users, adopting robust backend paradigms proves that platforms no longer have to compromise between cutting-edge trading velocity and uncompromised structural security.

Get Paid to Onboard? Try WEEX’s New Homepage with Rewards for Registration, Deposit & Trade
WEEX Custom Layout: Build Your Perfect Trading Workspace in Seconds
Morning Report | BitMine increased its holdings by 126,971 ETH last week; trader Eugene announced his exit from the crypto market
Wang Chuan: How can one not feel anxious after the neighbor Old Wang made thirty times profit by investing in storage stocks? (Seven) - A quarter-century cycle
Cryptocurrency CEXs are flocking to sell US stocks, and traditional brokerages are facing an "uninvited guest."
$75 billion in foreign capital has fled, and South Korean retail investors have absorbed it all using leverage
Japan’s Three Megabanks Plan Joint Stablecoin Issuance in Fiscal 2026
MUFG, SMBC, and Mizuho reportedly plan to jointly issue fiat-pegged stablecoins in fiscal 2026, signaling Japan’s growing push into bank-led digital payment infrastructure.
Humanity Discloses H Token Dual-Chain Attack Details, With Losses on Ethereum and BSC Exceeding $36 Million
Humanity said the H token attack across Ethereum and BSC caused more than $36 million in losses after leaked ProxyAdmin keys enabled malicious contract upgrades and token minting.
