 Buy Crypto
- Markets
 Futures
- Spot
- Copy Trade
- Earn
- More
Wall Street Flash Mob Run? Mega-Cap Stock Plunge, Goldman's Great Escape, Illustrated Guide to Private Credit Crisis


On Monday, April 6, 2026, the U.S. private credit asset management giant Blue Owl Capital (OWL) saw its stock price drop to $8.45 at the close, hitting a new low since its listing, with an intraday dip to $7.80. The event that triggered this round of selling was the disclosure by Blue Owl the previous Thursday of first-quarter semi-liquid fund redemption data. Its two main illiquid BDCs (Business Development Companies), OTIC (Blue Owl Technology Income) and OCIC (Blue Owl Credit Income), received approximately $5.4 billion in investor redemption requests this quarter, with OTIC seeing a redemption rate of 40.7% of outstanding shares and OCIC at 21.9%. Both funds simultaneously triggered a 5% hard industry gate, only allowing the release of less than $1.2 billion proportionally.
Mainstream financial media immediately framed this as the "Retail Private Credit Narrative Collapse" and "AI Disruption Spillover into Debt Holders." However, these two labels obscured a more critical issue. In the same week, Goldman Sachs Private Credit Corp, under Goldman Sachs Asset Management, had a first-quarter redemption request proportion of 4.999%, just 0.001 percentage points below the 5% gate, making it one of the few, and possibly the only large semi-liquid perpetual BDC that did not trigger the gate, providing full redemption to exiting investors. This redemption wave was not a "private credit collapse" but a clear K-shaped differentiation.
According to Bloomberg's report on April 6, Goldman's $15.7 billion fund was an outlier this quarter in "Dodging Exodus." Meanwhile, Blue Owl's OTIC redemption rate was 8.1 times that of Goldman, and OCIC was 4.4 times. While market attention was entirely focused on Blue Owl's plunge, the real question worth asking is why, with the same structure, the same week, and the same 5% gate, the two institutions presented entirely different outcomes.
Stock Price Evaporates Two-Thirds in Fifteen Months
First, let's look at the market's pricing of Blue Owl. According to Yahoo Finance's historical weekly data, Blue Owl Capital (OWL) closed at $25.02 on January 20, 2025, marking its all-time high. By the week of April 6, 2026, it closed at $8.45, plummeting by 66.2% over fifteen months, evaporating nearly two-thirds of its market value.
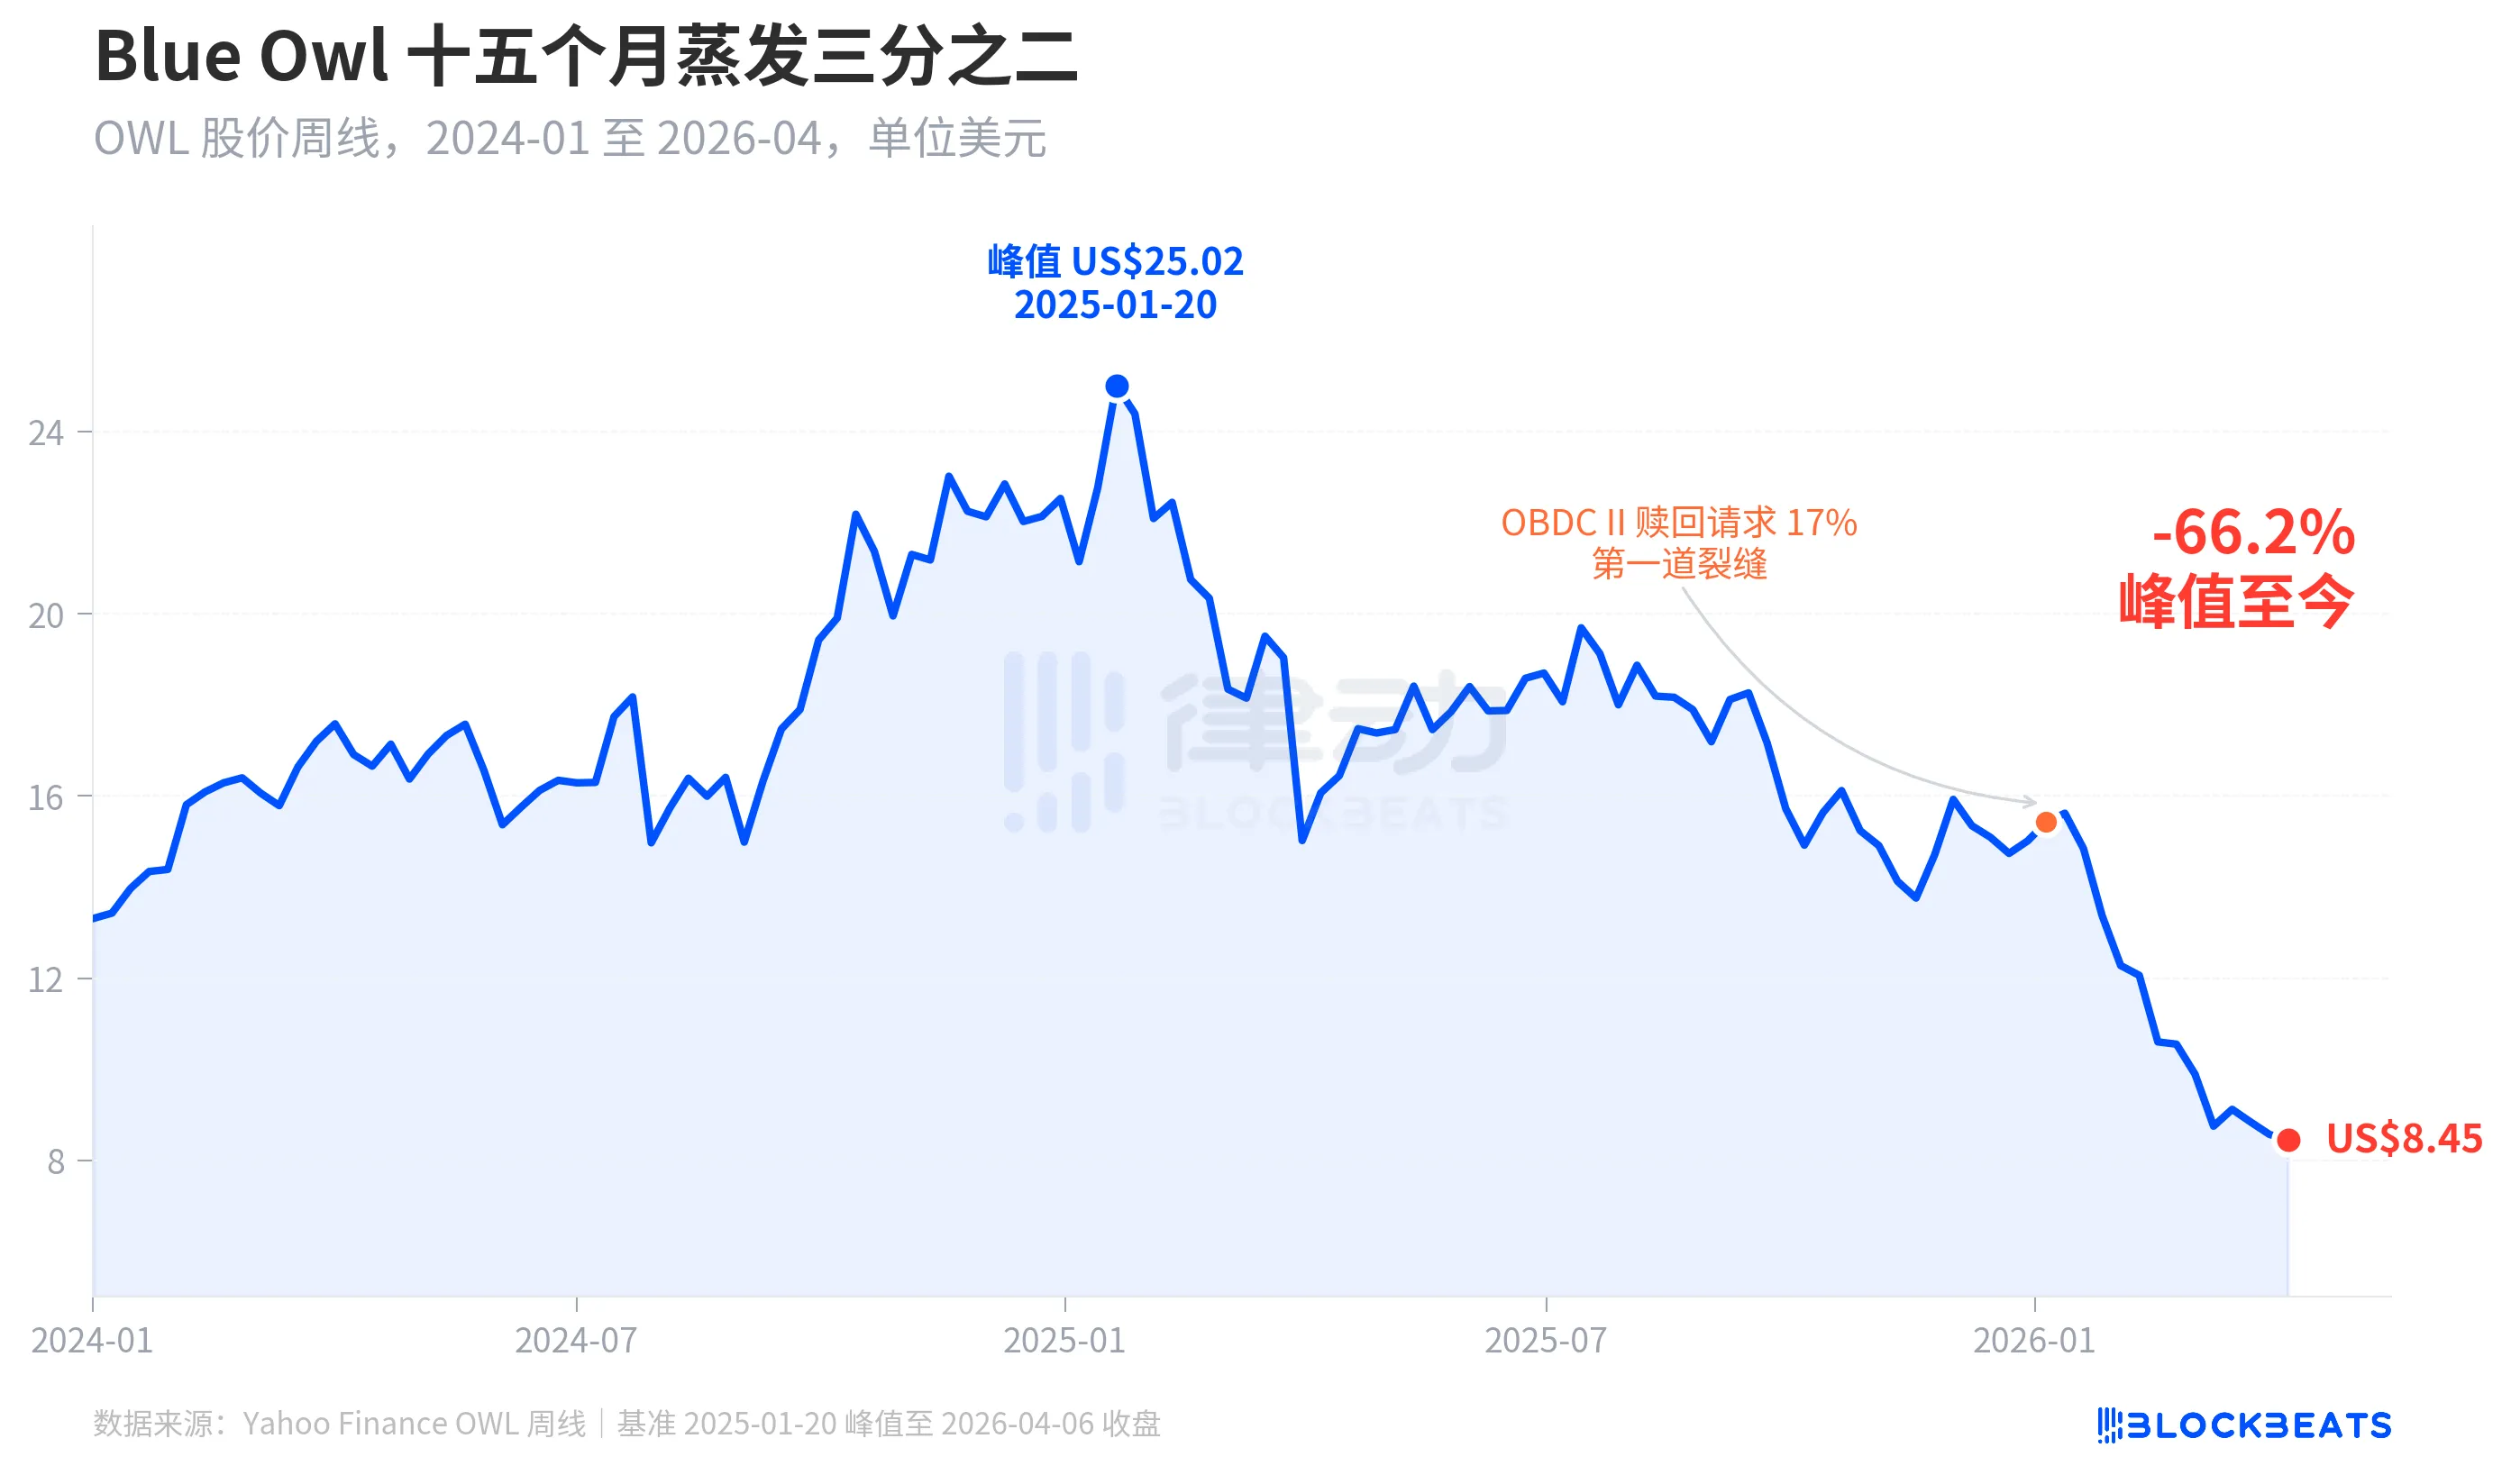
The first significant crack in the stock price appeared in early January 2026 when another fund under Blue Owl, OBDC II (a smaller private BDC), disclosed receiving redemption requests equivalent to 17% of outstanding shares, seen as the "first crack." Subsequently, the stock price declined steadily until the end of the first quarter, when both OTIC and OCIC, two flagship funds, simultaneously triggered gates, with the intraday price touching a record low of $7.80 since the IPO.
Interestingly, the decline in Blue Owl's stock price (-66.2%) far exceeded the degree of its fundamental deterioration. OCIC still holds $36 billion in AUM, with a first-quarter 2026 NAV decline of approximately 6.5%, and the company's total AUM remains above $290 billion. The market appears to be repricing the company based on factors such as "uncertainty of future redemptions" and "confidence erosion in valuations," rather than solely on current performance.
Same Gate, Different Destinies
What truly illustrates "K-shaped divergence" is the cross-section. When five large semi-liquid perpetual BDCs that publicly disclosed redemption data in the first quarter of 2026 are compared, the structural differences become clear.
According to Bloomberg, CNBC, and each fund's corporate announcements, the redemption rates of the five funds are as follows: Blue Owl OTIC 40.7%, Blue Owl OCIC 21.9%, Apollo Debt Solutions 11.2%, Morgan Stanley North Haven Private Income Fund 10.9%, Goldman Sachs Private Credit Corp 4.999%. These five funds can roughly be divided into three tiers.
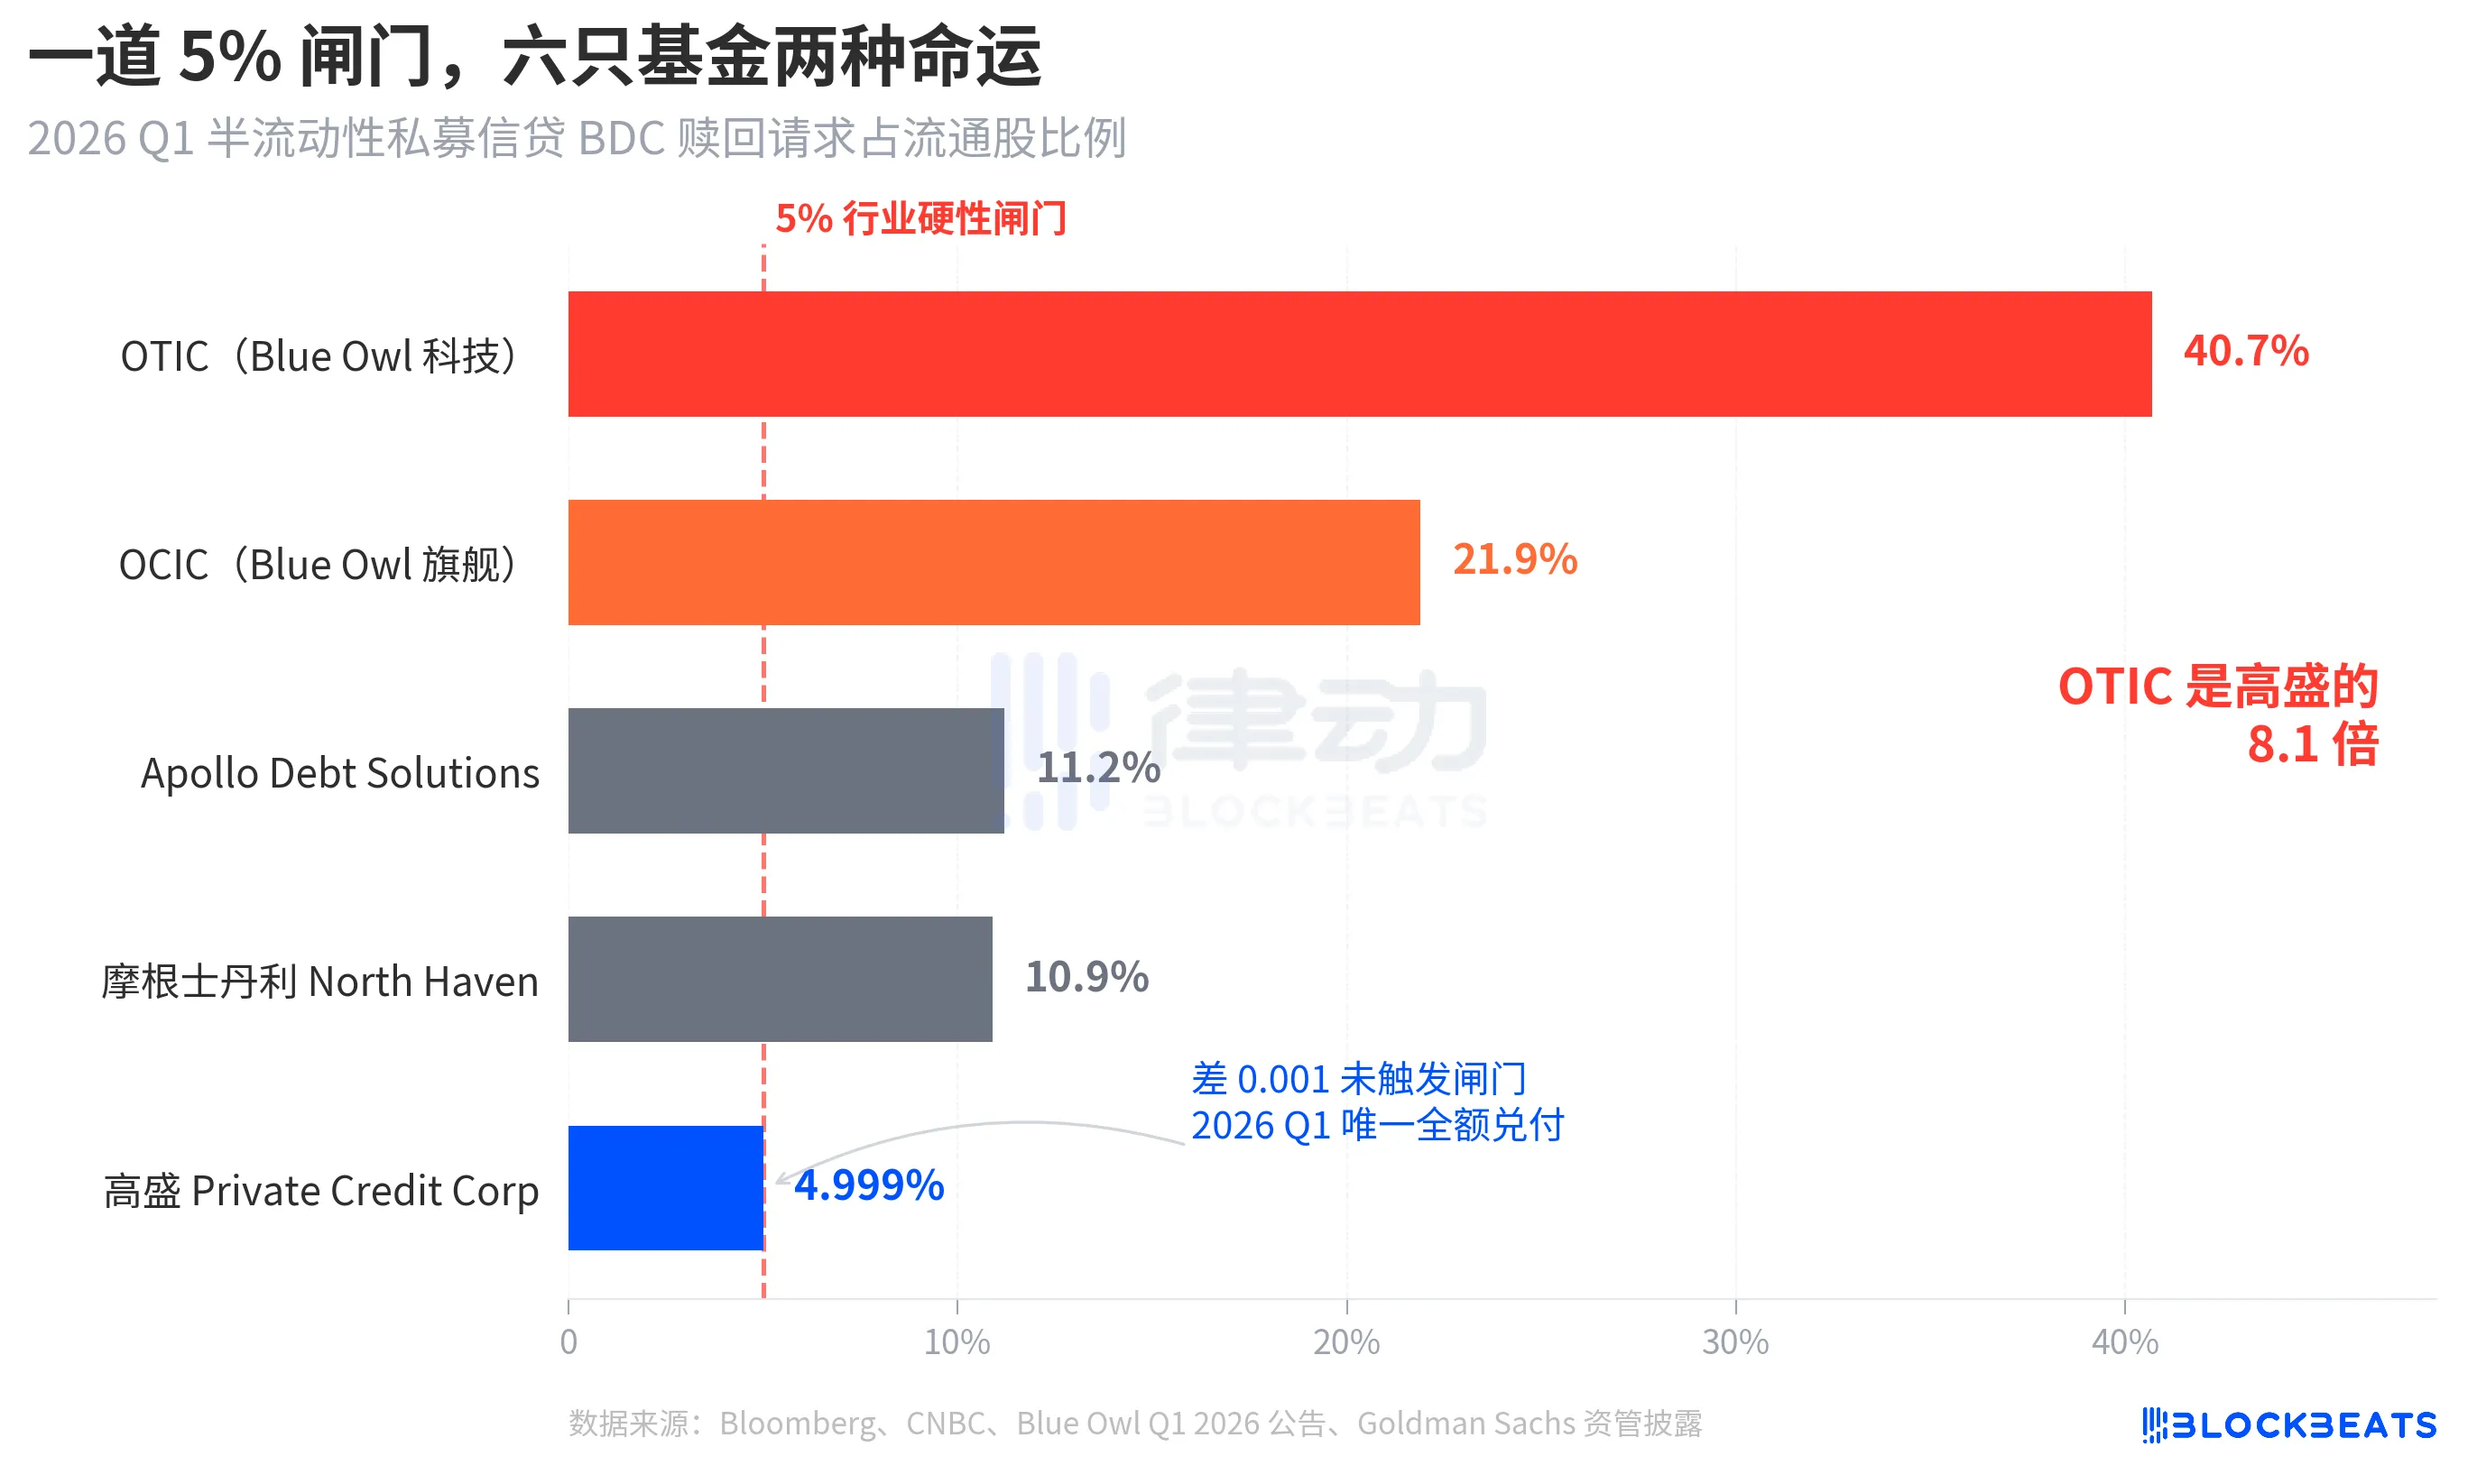
In the top tier, both Blue Owl funds significantly exceeded the gate, with almost half of OTIC's shareholders looking to withdraw and OCIC nearly four times the gate. Following the rule to only allow redemptions of up to 5% of outstanding shares, OTIC actually redeemed approximately $179 million, while OCIC redeemed around $988 million, locking out over $4.2 billion in excess redemption requests beyond the gate.
In the middle tier, both Apollo and Morgan Stanley have redemption rates ranging from 10% to 11%. According to Bloomberg reports on March 11 and March 23, Apollo Debt Solutions redeemed about 45% of requests, North Haven redeemed about 46%, also triggering gates but with significantly less pressure compared to Blue Owl.
Undergate, only Goldman Sachs. 4.999% is the only large fund that did not trigger the 5% gate at the same time, with all redemption requests being fully redeemed.
Bloomberg used "Dodges Exodus" in the article title, with OTIC being Goldman Sachs' 8.1x this figure, which in itself indicates the intensity of differentiation. In the same week, with the same structure, under the same rules, the fate of the two institutions is completely different.
Bubble, Retail Investors Drive It Up 4.4x
To understand why this redemption wave came so fiercely, you first need to see how deep the incoming water is. According to industry statistics from Robert A. Stanger & Co., the annual fundraising scale of U.S. non-traded BDCs over the past five years has shown a clear parabolic trend.
From $14.3 billion for the full year 2021 to a historical record of $63 billion for the full year 2025, a 4.4x increase over five years. The same statistics show that the top five institutions (Blackstone, Blue Owl, Apollo, Ares, and HPS) took about 83% of this, around $52.3 billion flowing into the top five. The retail funds that poured in over the past five years were not only enormous in total amount but also extremely concentrated in distribution.
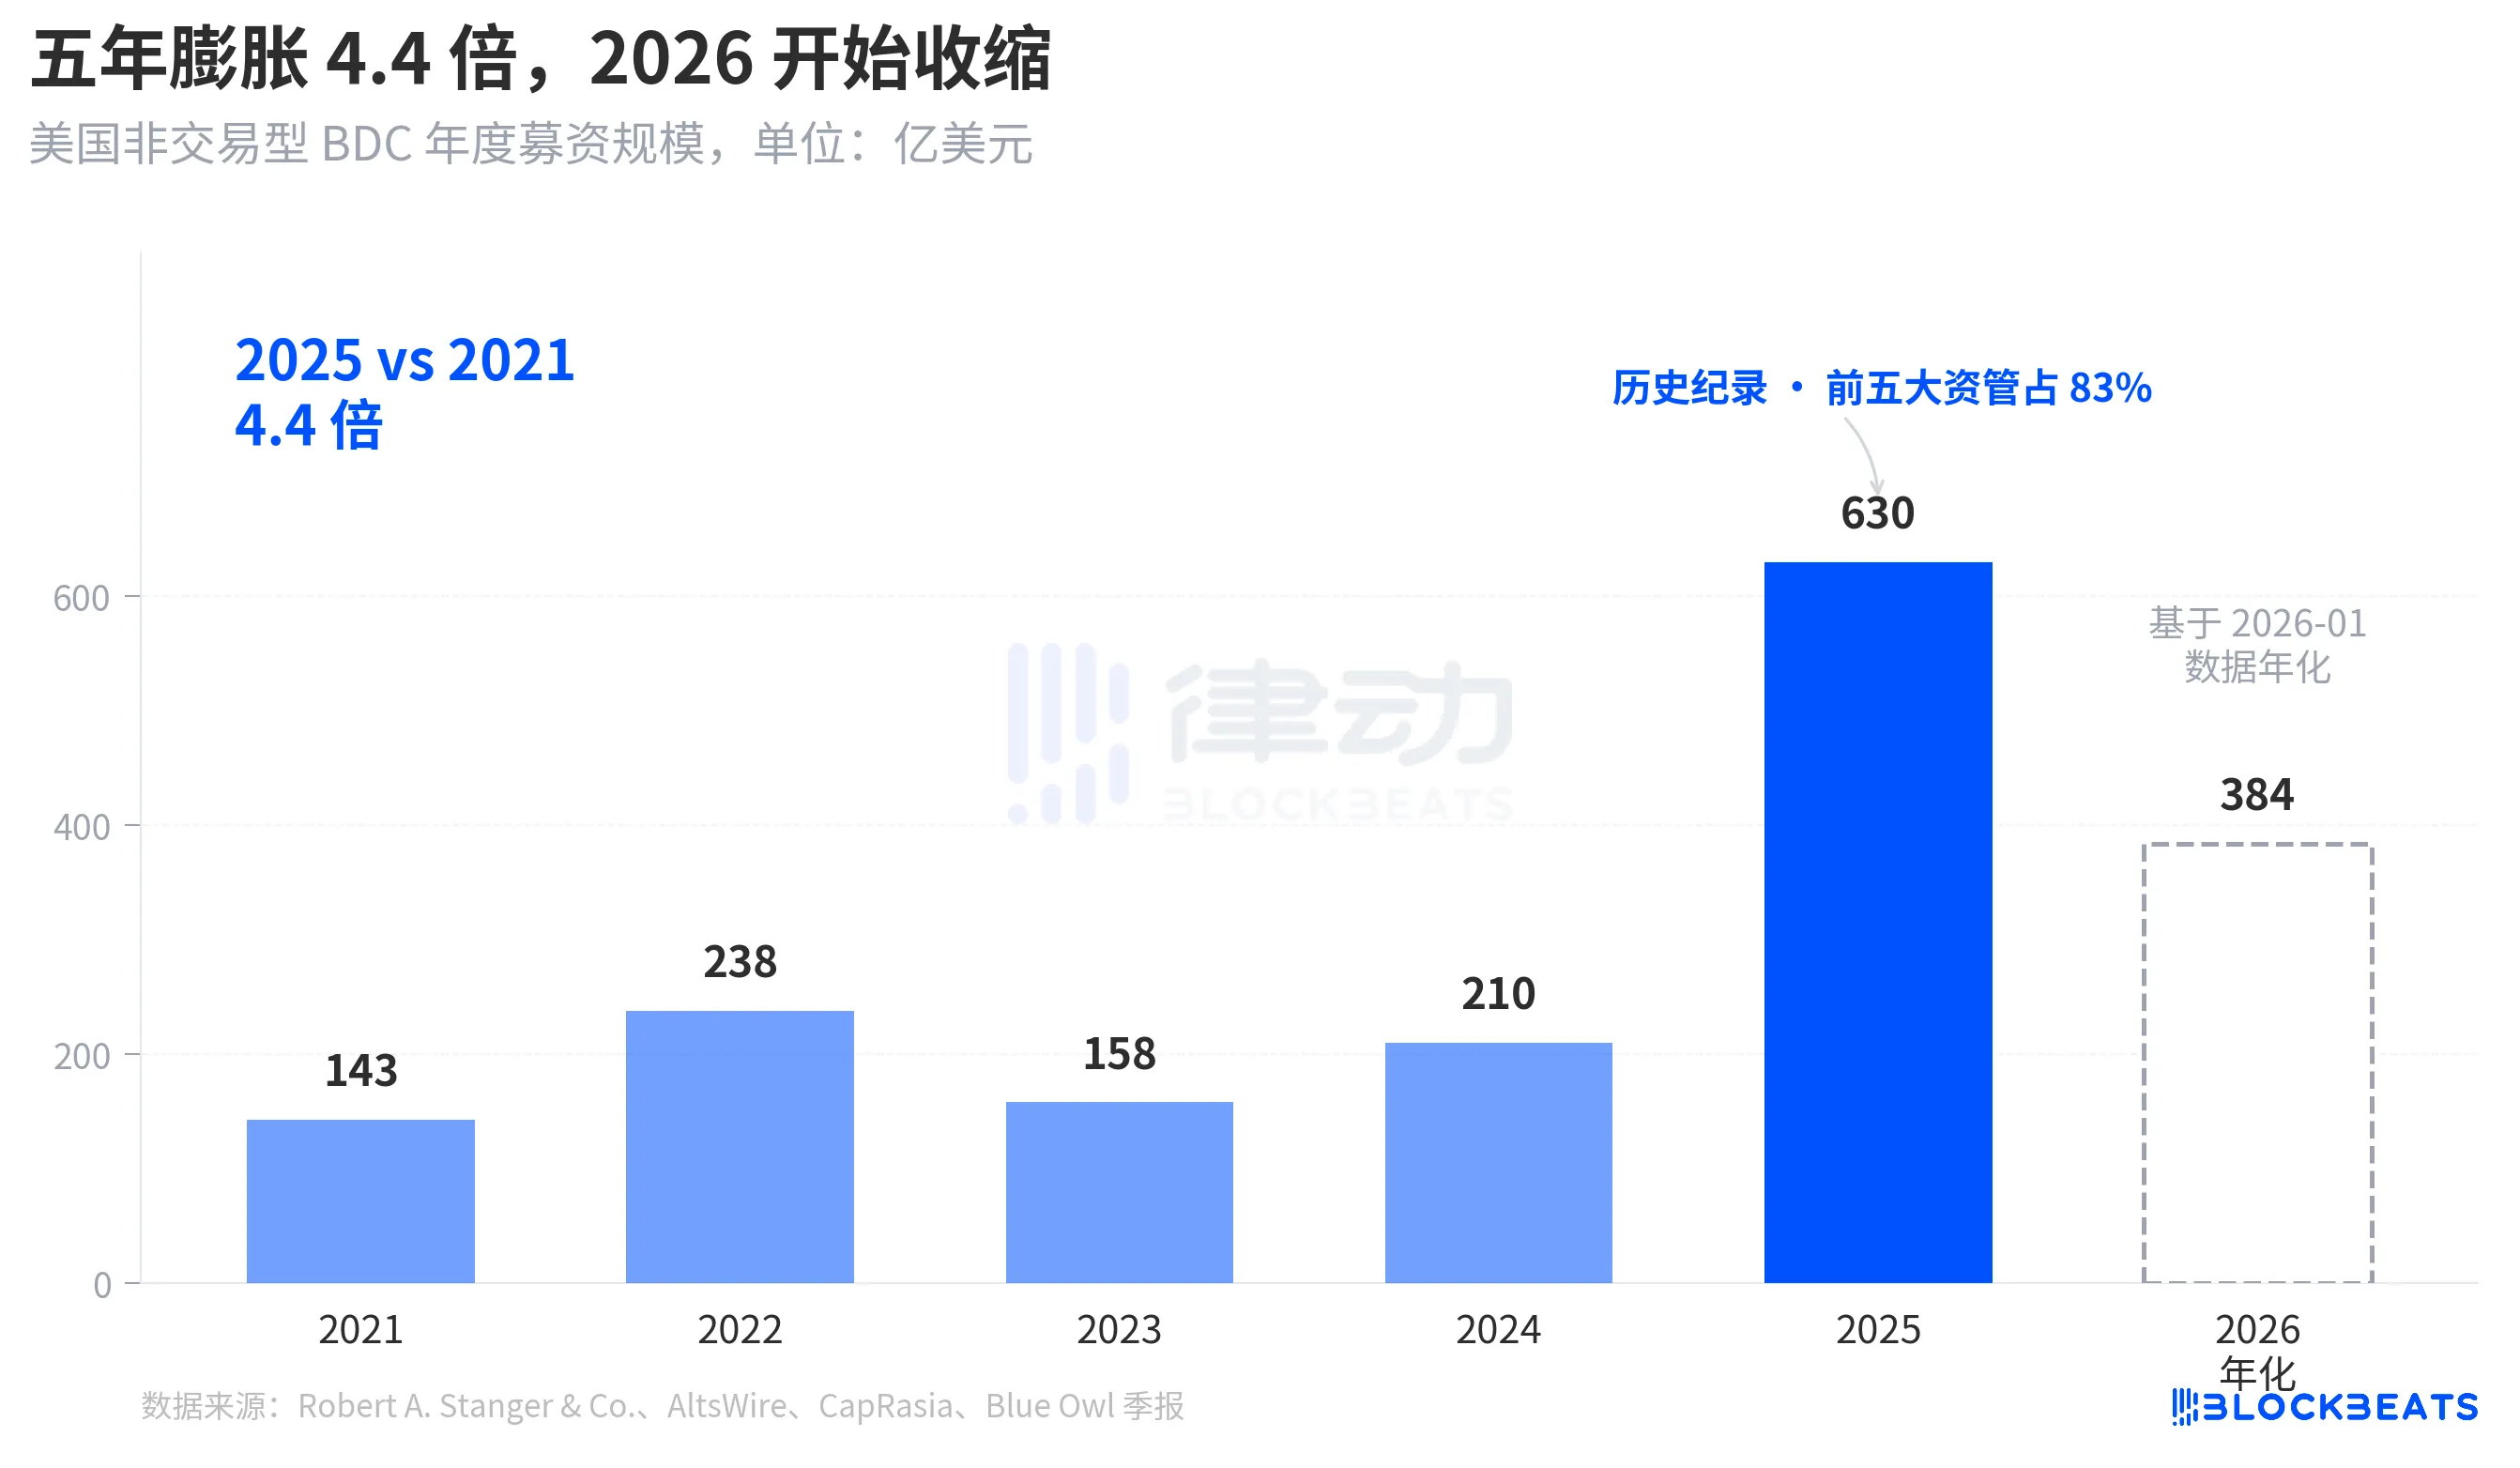
However, as of January 2026, Stanger's monthly data shows that non-traded BDC fundraising was only $3.2 billion, nearly half of the peak of $6.2 billion in March 2025. According to reports from Connect Money and FinancialContent, BDC overall sales in the first quarter of 2026 decreased by about 40% compared to the same period last year. In the same quarter when investors began concentrating redemption requests, new inflows visibly decelerated. The simultaneous rise in redemption pressure and decline in new purchases caused the gate to be slammed harder than anyone had expected.
This is not a cyclical retracement but a narrative shift, with BDCs as a semi-liquid perpetual "savings-like product" sold to retail investors being reexamined at the fund level for the first time.
From BREIT to Blue Owl, Vulnerability Becomes Evident Over Four Years
Placing this redemption wave on a longer timeline reveals that it did not erupt suddenly.
The structure of "semi-liquid perpetual" has two layers of commitment. It allows funds to remain unlisted, with no public valuation, while promising investors to redeem a portion of shares quarterly based on NAV. Essentially, this packages illiquid assets (private credit, private real estate) into a product that "seemingly allows for immediate withdrawal." To prevent a run, the industry uniformly set a 5% quarterly redemption gate, where once redemption requests exceed 5% of outstanding shares, the fund redeems proportionally, and the remaining requests are locked up until the next quarter.
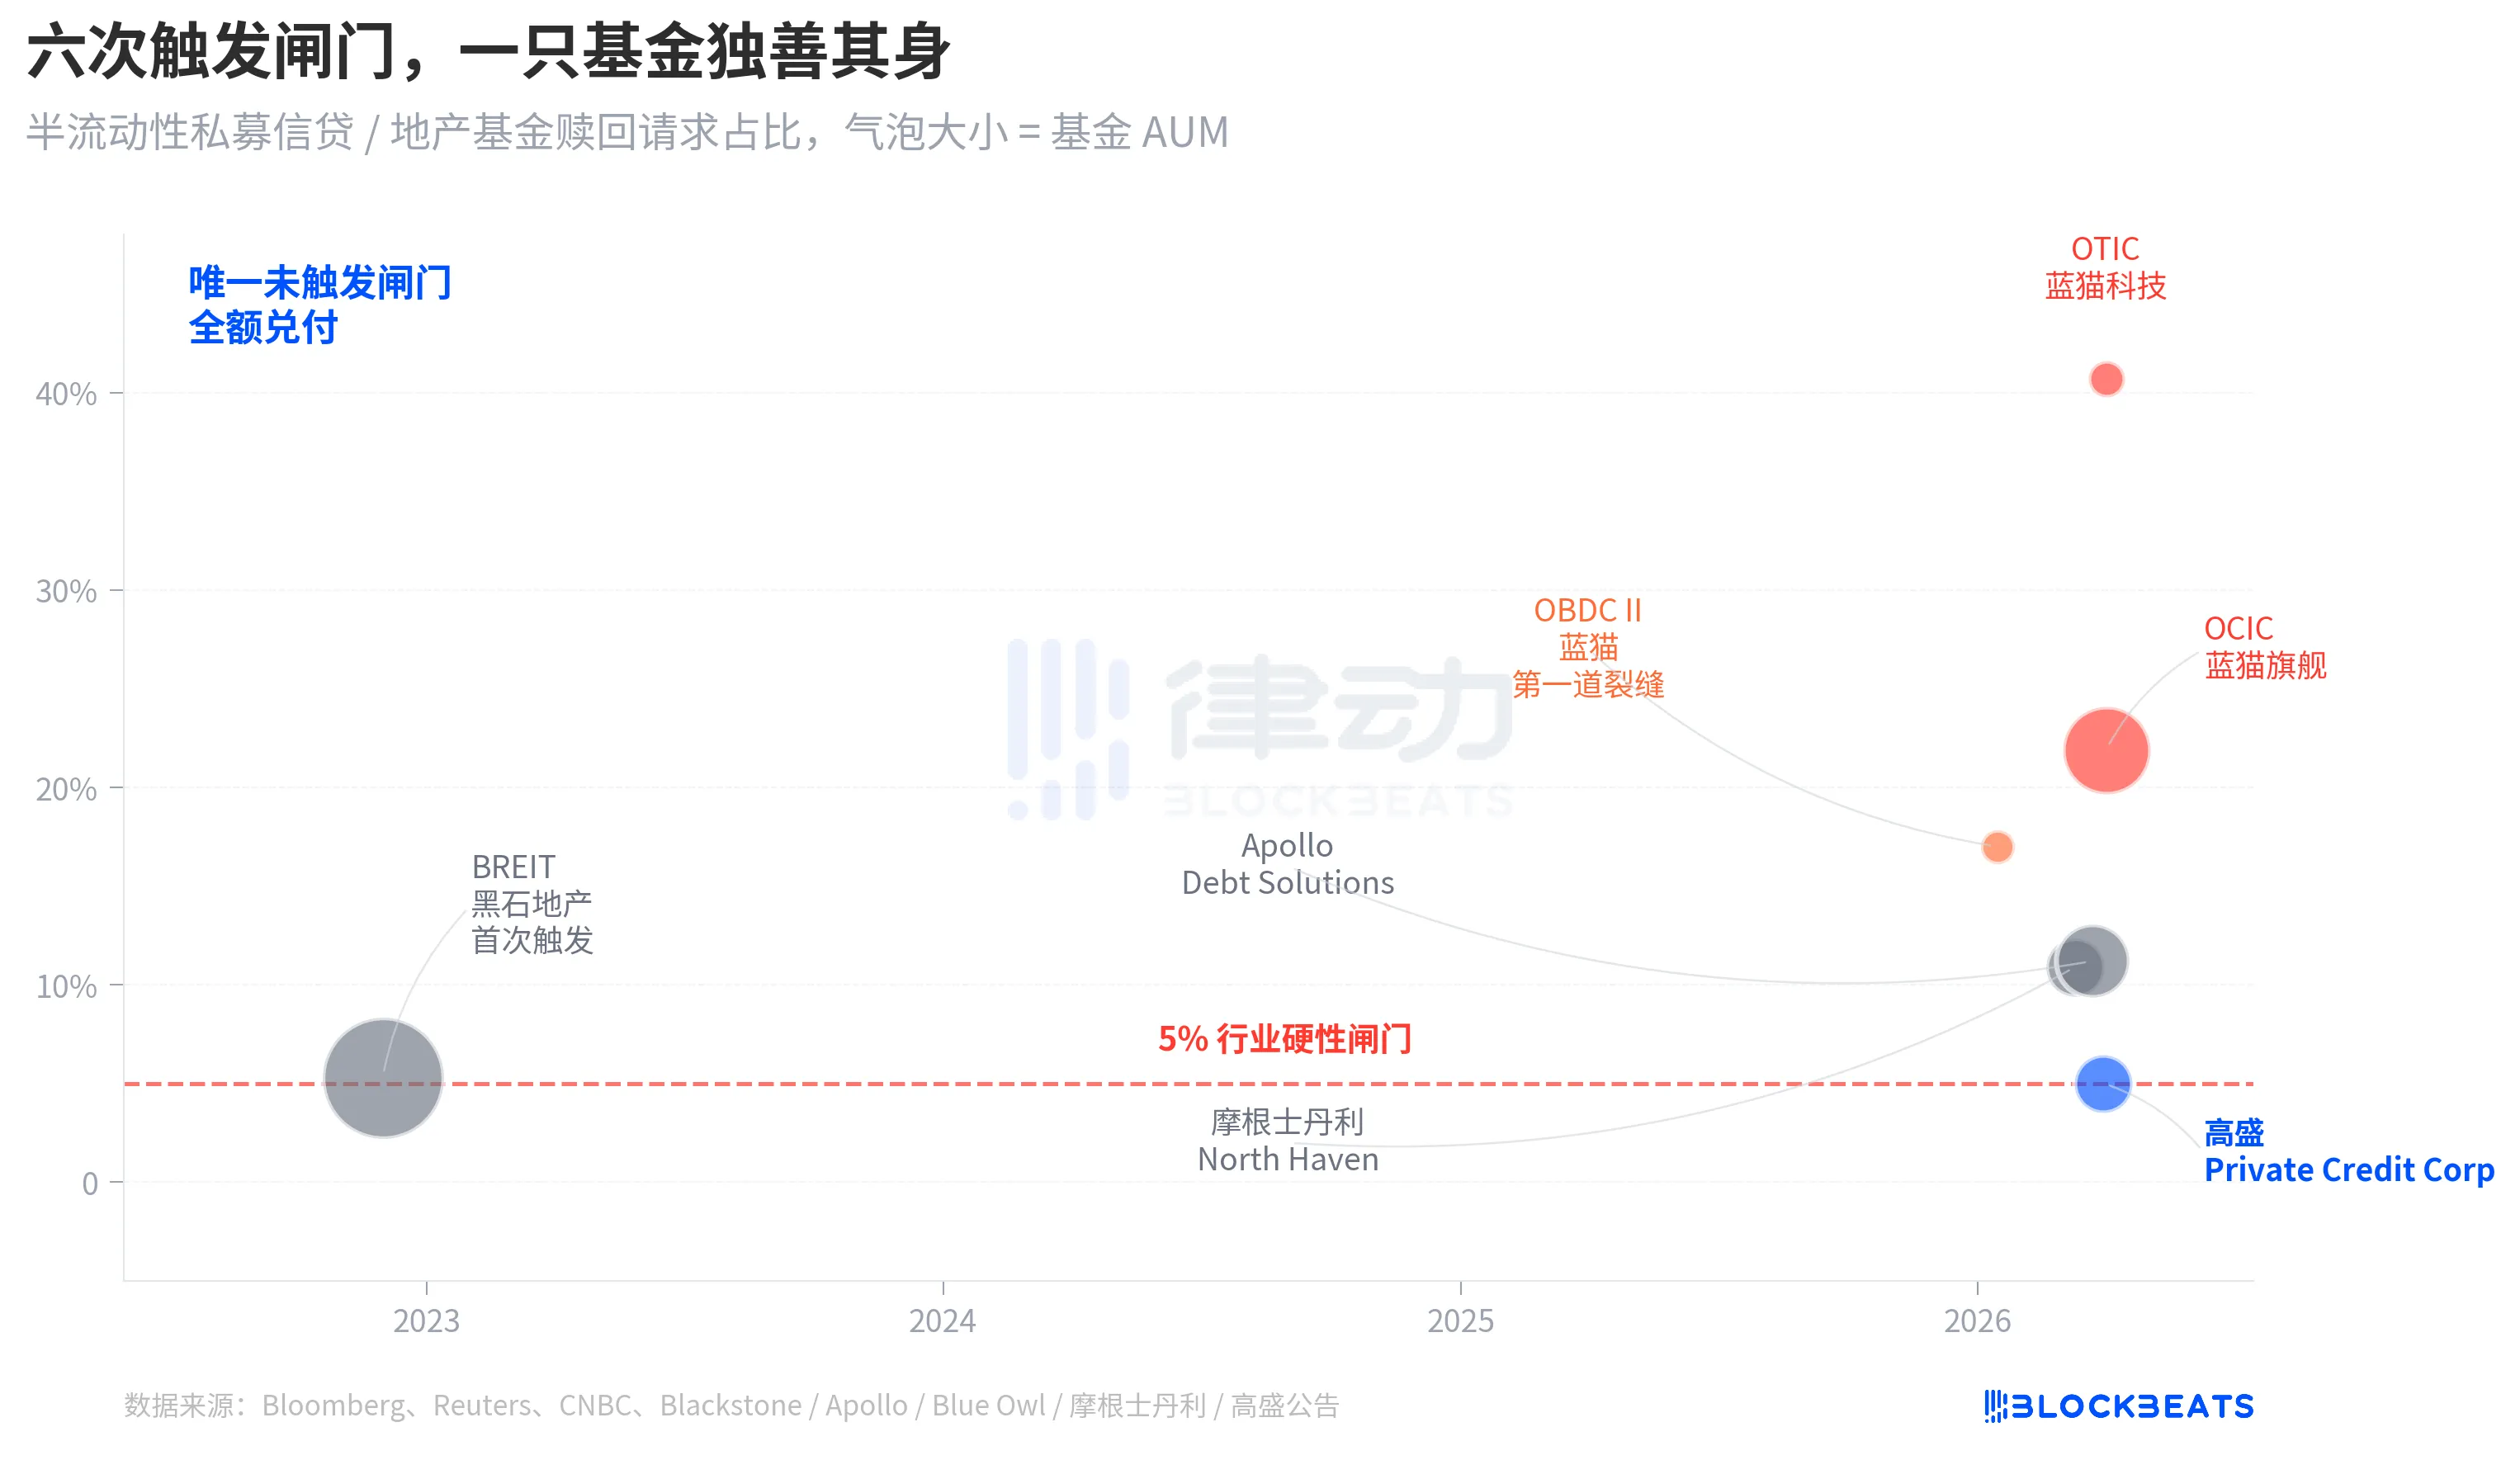
In November 2022, Blackstone's non-traded real estate investment trust BREIT triggered this gate for the first time, becoming the inaugural systematic liquidity event of a perpetual semi-liquid structure. According to Caproasia data, in January 2023, BREIT only honored 25% of redemption requests for the month, totaling $14.3 billion in redemptions by November 2023. Seen as an isolated event within the real estate asset class, the private credit market was not dragged down.
Four years later, the same fault line that had spread through real estate reached credit. In January 2026, Blue Owl OBDC II disclosed a 17% redemption request, serving as the first signal. On March 11, Morgan Stanley North Haven triggered the gate. On March 23, Apollo Debt Solutions triggered the gate. On April 2, both Blue Owl OCIC and OTIC simultaneously triggered the gate. Within seven days, four top asset-managed large BDCs were consecutively caught in the same threshold, while Goldman Sachs remained outside the gate that quarter with a 4.999% margin.
The structural fragility of the semi-liquid perpetual BDC was not exposed by Blue Owl's redemption surge; it had been on the table since BREIT's 2022 event, but no one had truly taken it seriously in four years.
Root Cause: 80% of OTIC Exposure in Tech and Healthcare
Now back to that critical question: Why did Goldman Sachs and Blue Owl have such divergent outcomes with the same structure in the same week? Disaggregating OTIC's portfolio provides a clear answer.
According to a KBRA rating report and Blue Owl OTIC's Q4 2024 financials, as of the end of 2025, OTIC's portfolio size was $6.2 billion, holding stakes in 190 companies across 39 end markets, with 92% backed by private equity funds and 93% being first-lien senior secured loans. On paper, this is a fundamentally sound fund, but its industry concentration is quite unique. System software accounts for 16.1%, medical technology for 13.0%, and application software for 12.4%, totaling 41.5% in just these three subsectors.
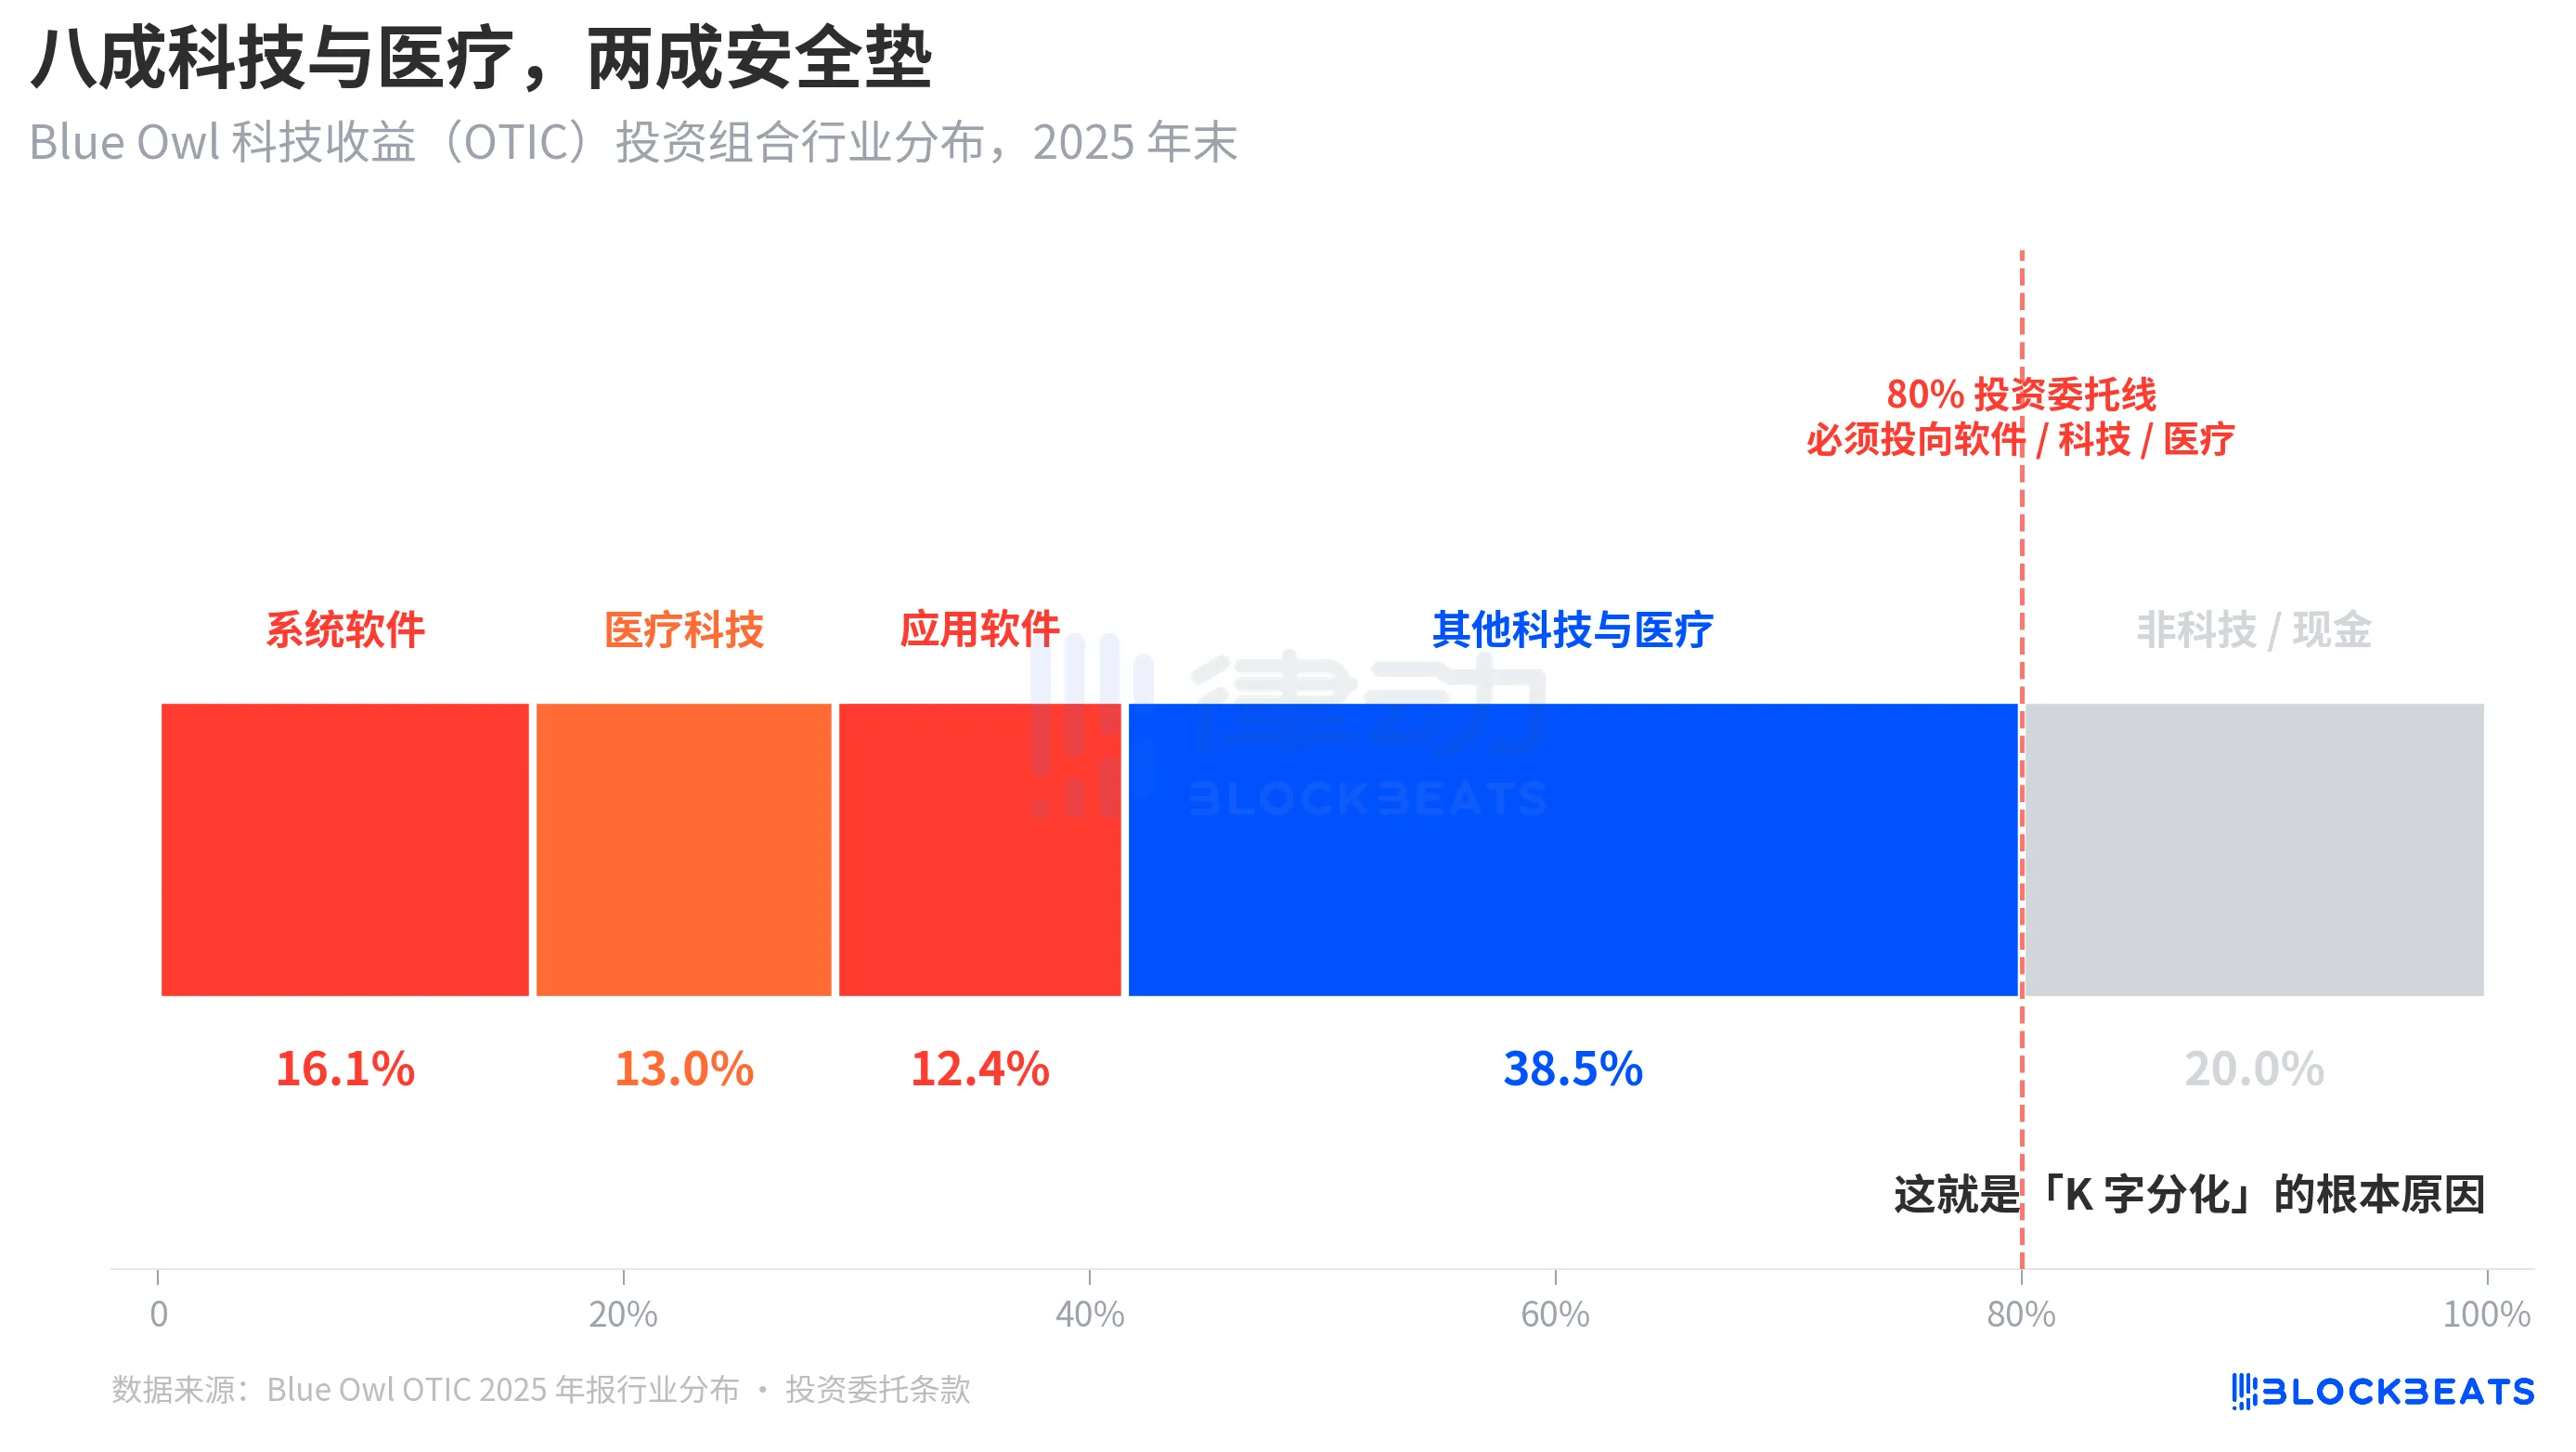
The key point is that this is not a temporary industry preference of the manager, but a hard rule written into the OTIC investment charter, requiring at least 80% of total assets to be invested in "software and tech-related" companies. Blue Owl describes OTIC in its public materials as primarily investing in large, market-leading software companies that provide mission-critical, recurring revenue solutions. OTIC was designed from the outset to be a SaaS technology credit fund.
Within the market narrative of the past six months, SaaS has been one of the asset classes most severely repriced by AI. When investors began to worry about the "AI disruption of long-term subscription revenue for software companies," a private credit fund with an 80% exposure to software and technology was particularly affected. According to Bloomberg and Reuters, Blue Owl's management themselves acknowledged in their communications to investors that part of the first-quarter redemption pressure came from "AI disrupting software companies."
In contrast, the investment portfolio of Goldman Sachs Private Credit Corp (with $15.7 billion AUM) was described by Bloomberg as "significantly more diversified than its peers," with no single industry exposure reaching OTIC's level of tech exposure. Similar private credit, similar semi-liquid structure, similar 5% gate, but one had an exposure of over 80% to the current market theme while the other had less than 15%, resulting in a redemption rate of 40.7% for one and 4.999% for the other.
This is the fundamental reason for the "K-shaped differentimentation." It's not that private credit as an asset class collapsed, but rather that funds concentrated on the same market theme ran into trouble, while diversified funds were hardly affected. The differentiation occurred at the risk exposure level, not at the structural level.
Wrap-Up
JPMorgan CEO Jamie Dimon, in the shareholder letter for 2026 released on April 6, happened to coincide with the day Blue Owl hit a new low. In the letter, he wrote: Private credit, in general, lacks transparency and strict loan valuation markings, which makes people more likely to sell if they think the environment will worsen, even if the actual losses have hardly changed.
Dimon's statement points to a structural issue. Private credit is difficult to mark-to-market, and holders' perception of risk is more sensitive than actual losses. Reading this on April 7, 2026, has two meanings. One is that 0.001% difference at Goldman Sachs was more a result of a diversified structure than luck. The other is that the entire $1.8 trillion private credit market has yet to resolve the underlying contradiction of "liquidity versus opaque portfolio."
A 5% threshold failed to split Blue Owl and Goldman Sachs into a "good fund" and a "bad fund"; it simply settled two different investment decisions — "concentrated bet on current theme" and "diversification" — in a single candlestick.
You may also like

Consumer-grade Crypto Global Survey: Users, Revenue, and Track Distribution

Prediction Markets Under Bias

Stolen: $290 million, Three Parties Refusing to Acknowledge, Who Should Foot the Bill for the KelpDAO Incident Resolution?

ASTEROID Pumped 10,000x in Three Days, Is Meme Season Back on Ethereum?

ChainCatcher Hong Kong Themed Forum Highlights: Decoding the Growth Engine Under the Integration of Crypto Assets and Smart Economy

Why can this institution still grow by 150% when the scale of leading crypto VCs has shrunk significantly?

Anthropic's $1 trillion, compared to DeepSeek's $100 billion

Geopolitical Risk Persists, Is Bitcoin Becoming a Key Barometer?

Annualized 11.5%, Wall Street Buzzing: Is MicroStrategy's STRC Bitcoin's Savior or Destroyer?

An Obscure Open Source AI Tool Alerted on Kelp DAO's $292 million Bug 12 Days Ago

Mixin has launched USTD-margined perpetual contracts, bringing derivative trading into the chat scene.
The privacy-focused crypto wallet Mixin announced today the launch of its U-based perpetual contract (a derivative priced in USDT). Unlike traditional exchanges, Mixin has taken a new approach by "liberating" derivative trading from isolated matching engines and embedding it into the instant messaging environment.
Users can directly open positions within the app with leverage of up to 200x, while sharing positions, discussing strategies, and copy trading within private communities. Trading, social interaction, and asset management are integrated into the same interface.
Based on its non-custodial architecture, Mixin has eliminated friction from the traditional onboarding process, allowing users to participate in perpetual contract trading without identity verification.
The trading process has been streamlined into five steps:
· Choose the trading asset
· Select long or short
· Input position size and leverage
· Confirm order details
· Confirm and open the position
The interface provides real-time visualization of price, position, and profit and loss (PnL), allowing users to complete trades without switching between multiple modules.
Mixin has directly integrated social features into the derivative trading environment. Users can create private trading communities and interact around real-time positions:
· End-to-end encrypted private groups supporting up to 1024 members
· End-to-end encrypted voice communication
· One-click position sharing
· One-click trade copying
On the execution side, Mixin aggregates liquidity from multiple sources and accesses decentralized protocol and external market liquidity through a unified trading interface.
By combining social interaction with trade execution, Mixin enables users to collaborate, share, and execute trading strategies instantly within the same environment.
Mixin has also introduced a referral incentive system based on trading behavior:
· Users can join with an invite code
· Up to 60% of trading fees as referral rewards
· Incentive mechanism designed for long-term, sustainable earnings
This model aims to drive user-driven network expansion and organic growth.
Mixin's derivative transactions are built on top of its existing self-custody wallet infrastructure, with core features including:
· Separation of transaction account and asset storage
· User full control over assets
· Platform does not custody user funds
· Built-in privacy mechanisms to reduce data exposure
The system aims to strike a balance between transaction efficiency, asset security, and privacy protection.
Against the background of perpetual contracts becoming a mainstream trading tool, Mixin is exploring a different development direction by lowering barriers, enhancing social and privacy attributes.
The platform does not only view transactions as execution actions but positions them as a networked activity: transactions have social attributes, strategies can be shared, and relationships between individuals also become part of the financial system.
Mixin's design is based on a user-initiated, user-controlled model. The platform neither custodies assets nor executes transactions on behalf of users.
This model aligns with a statement issued by the U.S. Securities and Exchange Commission (SEC) on April 13, 2026, titled "Staff Statement on Whether Partial User Interface Used in Preparing Cryptocurrency Securities Transactions May Require Broker-Dealer Registration."
The statement indicates that, under the premise where transactions are entirely initiated and controlled by users, non-custodial service providers that offer neutral interfaces may not need to register as broker-dealers or exchanges.
Mixin is a decentralized, self-custodial privacy wallet designed to provide secure and efficient digital asset management services.
Its core capabilities include:
· Aggregation: integrating multi-chain assets and routing between different transaction paths to simplify user operations
· High liquidity access: connecting to various liquidity sources, including decentralized protocols and external markets
· Decentralization: achieving full user control over assets without relying on custodial intermediaries
· Privacy protection: safeguarding assets and data through MPC, CryptoNote, and end-to-end encrypted communication
Mixin has been in operation for over 8 years, supporting over 40 blockchains and more than 10,000 assets, with a global user base exceeding 10 million and an on-chain self-custodied asset scale of over $1 billion.

$600 million stolen in 20 days, ushering in the era of AI hackers in the crypto world
Vitalik's 2026 Hong Kong Web3 Summit Speech: Ethereum's Ultimate Vision as the "World Computer" and Future Roadmap
On the same day Aave introduced rsETH, why did Spark decide to exit?
Full Post-Mortem of the KelpDAO Incident: Why Did Aave, Which Was Not Compromised, End Up in Crisis Situation?

After a $290 million DeFi liquidation, is the security promise still there?
ZachXBT's post ignites RAVE nearing zero, what is the truth behind the insider control?