Coinbase Monthly Outlook: Bitcoin and COIN50 Both Break Key Support, How Far is the Market from a Rebound?

Original Article Title: Monthly Outlook: How Do You Define a Crypto Bear Market?
Original Article Author: David Duong, CFA - Global Head of Research
Original Article Translation: Daisy, ChainCatcher
Key Points Summary:
As of mid-April, the total cryptocurrency market capitalization excluding Bitcoin has dropped from its December 2024 peak of $1.6 trillion to $950 billion, a 41% decline. Additionally, venture capital funding has also decreased by 50% to 60% compared to the levels seen in 2021-2022.
We believe that a conservative risk management approach should be taken at this stage. However, we expect the cryptocurrency market prices to stabilize in the latter half of the second quarter of 2025, setting the stage for a rebound in the third quarter.
Overview
Multiple factors are converging, potentially signaling the onset of a new phase of the "crypto winter." With global tariff policies being implemented and possibly escalated, market sentiment has significantly deteriorated. As of mid-April, the total cryptocurrency market capitalization excluding Bitcoin has dropped to $950 billion, a 41% decline from the peak of $1.6 trillion in December 2024, representing a 17% year-over-year decrease. It is worth noting that this level is even lower than the market cap performance for almost the entire period from August 2021 to April 2022.
In the first quarter of 2025, venture capital investment in the crypto industry saw a slight recovery compared to the previous quarter, but it remains 50% to 60% lower than the peak levels seen in 2021 to 2022. This has significantly restricted new capital inflows into the ecosystem, with a more pronounced impact on the altcoin sector. The structural pressure mentioned above is mainly derived from the current macroeconomic uncertainty. Fiscal tightening and tariff policies continue to suppress traditional risk assets, leading to a stagnation in investment decisions. Despite some support from the regulatory environment, the road to recovery for the crypto market remains challenging against the backdrop of overall stock market weakness.
A combination of factors has put the digital asset market in a challenging cyclical outlook, requiring caution in the short term (expected for the next 4 to 6 weeks). However, we believe that investors should adopt flexible tactics to navigate market fluctuations. Once market sentiment undergoes a full recovery, a rebound could quickly ensue. We remain optimistic about the market performance in the latter half of 2025.
Bull Market and Bear Market Classification
In the stock market, a common rule of thumb for determining a bull market or bear market is a 20% rise from a recent low or a 20% decline from a peak. However, this rule is inherently subjective and may not apply to the high volatility of the crypto market. Cryptocurrency assets often experience price swings of over 20% in a short period, but this does not necessarily indicate a fundamental shift in market trend. Historical data shows that, for example, Bitcoin can drop 20% in a week but still be in a long-term uptrend, and vice versa.
Furthermore, the crypto market operates 24/7, serving as a global sentiment indicator during traditional financial market closures (such as nights or weekends). As a result, cryptocurrency asset prices often exhibit stronger reactions to global events. For example, from January to November 2022, during the period of the Federal Reserve's aggressive interest rate hikes, the U.S. stock market (represented by the S&P 500 Index) experienced a cumulative 22% decline. In contrast, Bitcoin started declining earlier in November 2021 and saw a 76% decline over a similar period, approximately 3.5 times the decline in the stock market during the same period.
The Truth in Contradiction
It should be noted that the traditional "20% rule" used to define bull and bear markets is essentially a rule of thumb and has not yet been standardized. As U.S. Supreme Court Justice Potter Stewart famously said regarding defining obscenity, "I know it when I see it." Similarly, identifying market trends often relies more on experience and intuition rather than strict calculation models.
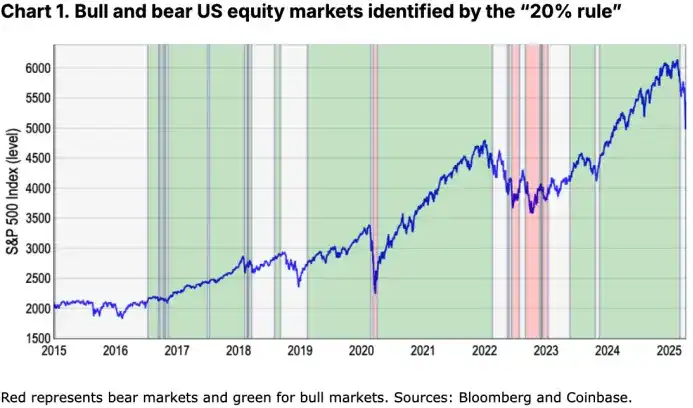
Nevertheless, to make judgments more systematic, we refer to the S&P 500 Index's high and low closing prices over a rolling one-year period to identify key market reversals. According to this method, over the past decade, the U.S. stock market has roughly experienced four bull markets and two bear markets—excluding the most recent downturn in late March to early April (our model has started signaling a bear market). Refer to Chart 1 for details.
However, the "20% threshold" also overlooks at least two significant pullback events that had a major impact on market sentiment but saw declines between 10% and 20%. For example, the increased volatility due to the late 2015 turmoil in the Chinese stock market and the market turbulence caused by the escalation of global trade tensions in 2018 (evidenced by the Fed's global trade policy uncertainty index). Refer to Chart 2 for details.

Historically, we have seen that emotion-driven market declines often trigger defensive portfolio adjustments even if the decline does not reach the artificially set 20% threshold. In other words, we believe that a bear market fundamentally reflects a structural shift in the market, characterized by deteriorating fundamentals and liquidity tightening, rather than just the magnitude of price declines. Additionally, the "20% rule" carries a paralysis risk as it overlooks some early warning signs, such as waning market depth and defensive sector rotation, which have often been harbingers of significant downturns in history.
Alternative Metrics
Therefore, we are trying to find alternative metrics that can more accurately reflect the relationship between price trends and investor psychology, applicable to both stocks and crypto assets. The definition of a bear market not only involves asset returns but is also closely related to market sentiment—which often determines whether investors believe the downtrend will continue and adjust their strategies accordingly. This concept is rather complex because what we are observing is not just a simple continuous uptrend or downtrend, but rather turning points in long-term trends. For example, the period during the COVID-19 pandemic is a typical case where the market experienced a rapid and intense decline followed by a quick rebound. Of course, the reason why this bear market was short-lived is largely due to the massive fiscal and monetary stimulus policies subsequently implemented by governments around the world, preventing investors from experiencing a prolonged drawdown.
Instead of relying on rules of thumb like the "20% rule," we prefer to use two types of risk-adjusted metrics: (1) risk-adjusted return performance measured by standard deviation; and (2) the 200-day moving average (200DMA). For example, from November 2021 to November 2022, Bitcoin's performance compared to the previous 365 days' average declined by 1.4 standard deviations; during the same period, the decline in the US stock market also reached 1.3 standard deviations. From a risk-adjusted perspective, Bitcoin's 76% decline and the S&P 500 Index's 22% decline can be considered relatively similar.

Since the standard deviation metric can naturally reflect the high volatility of the crypto market, the z-score (standard score) is very suitable for crypto asset analysis. However, it also has certain limitations: on the one hand, the calculation is relatively complex; on the other hand, there are fewer signals when the market trend is relatively stable, and the response to trend changes may not be sufficiently sensitive. For example, our model indicates that the recent bull market cycle ended in late February, and since then, the market status has been classified as "neutral," reflecting a potential lag in the model during periods of market volatility.

In contrast, the 200-day moving average (200DMA) provides a more concise and robust method for identifying sustained market trends. As it is calculated based on long-term data, it can effectively smooth out short-term fluctuations and adjust promptly based on the latest price trends, thereby providing clearer momentum signals.
The judgment method is also relatively intuitive:
· When the price remains consistently above the 200DMA and is accompanied by upward momentum, it is usually considered a bull market;
· When the price remains significantly below the 200DMA for an extended period and is accompanied by downward momentum, it often signifies the formation of a bear market.
This method not only aligns with the "20% Rule" and the z-score model's reflection of general trend signals but also enhances the practicality and forward-looking nature of insights in a dynamic market environment. For example, it successfully captured key downward cycles such as the early days of the 2020 pandemic, the 2022-2023 Fed rate hike cycle, reflected the 2018-2019 crypto winter, and the 2021 pullback due to China's mining ban.
In our view, this method not only aligns with the "20% Rule" and z-score model's reflection of general trend signals but also enhances the accuracy of extracting actionable insights in a dynamic market environment.
Furthermore, we have also found that the 200DMA better reflects the sharp fluctuations in investor sentiment during different periods. Refer to Charts 5 and 6 for details.


Crypto Winter?
So, have we entered a crypto bear market? Previous analyses have mainly focused on Bitcoin due to its sufficient historical data for comparison with traditional markets like the US stock market. However, as the crypto asset class continues to expand into emerging areas (such as Meme coins, DeFi, DePIN, AI agents, etc.), Bitcoin gradually no longer fully represents the overall market trend.
For example, Bitcoin's 200DMA model shows that since late March, its sharp pullback has entered a bear market phase. Analyzing the COIN50 Index (covering the top 50 tokens by market cap) using the same model reveals that since late February, this asset class has been significantly in a bear market state overall. This is consistent with the total crypto market capitalization excluding Bitcoin dropping 41% from the December 2024 peak to $950 billion; in contrast, Bitcoin's decline during the same period is less than 20%. This gap reflects that altcoins at the risk curve's tail end have higher volatility and risk premium.

Conclusion
As Bitcoin's "store of value" attribute continues to strengthen, we believe that the future requires a more systematic and comprehensive way to evaluate the overall performance of the crypto market to more accurately define its bull or bear market status, especially in an increasingly diverse asset category context. Nevertheless, both Bitcoin and the COIN50 Index have fallen below their respective 200-day moving averages, a signal indicating that the market may be in the early stages of a long-term downtrend. This aligns with the trends of total market value decline and venture capital contraction, both key characteristics indicating the potential onset of a "Crypto Winter."
Therefore, we recommend that a defensive risk management strategy be maintained in the current phase. Although we still expect cryptocurrency prices to stabilize in the latter part of the second quarter of 2025 and set the stage for improvement in the third quarter. At present, the complex macroeconomic environment still requires investors to remain highly cautious.
You may also like

The AI gamble of mining companies: Valuations enter a phase of differentiation, and it's hard to turn the tide

A letter from Alliance to entrepreneurs: Written on the occasion of Cursor selling for 60 billion dollars

Stablecoins Finally Find Real Returns: On-Chain Reinsurance Re Explained | Interview with Re Founder Karan Saroya

The impossible triangle is simply a pseudo problem

Will MicroStrategy fall into a death spiral? What will the macro trend be in the second half of the year?

Blockchain Capital Partner: The Core Secret of Arbitrage
STRC unanchored by 11%, can the perpetual motion machine of Strategy still operate?

Bitcoin Market Analysis 2026: Can BTC Reach $150K by Year-End?
Bitcoin ETF Outflows Hit a Record $4.4 Billion: What Are Traders Doing With Their Cash?
WEEX App Just Got Smarter – New Tabs for Faster Trades & Easy Asset Management

WEEX All-New Search Features: Find, Trade & Earn Faster Than Ever

Morning Report | Illinois signs the strictest digital asset tax law in the U.S.; RWA tokenization market size surpasses $43 billion, institutions accelerate the migration of on-chain assets
Full version of the debut Q&A! Federal Reserve Chairman Waller: Sticking to the 2% inflation target, establishing five special working groups, individual did not submit the dot plot

From Disruptor to Shadow Market: The Crypto Market is Becoming a Colony of Traditional Finance
Dalio's important long article: How to position in the current market environment?
OKX Star analyzes Binance's competitive advantages: when regulation levels the playing field, competition has just begun

New gameplay for participating in initial offerings on cryptocurrency exchanges
